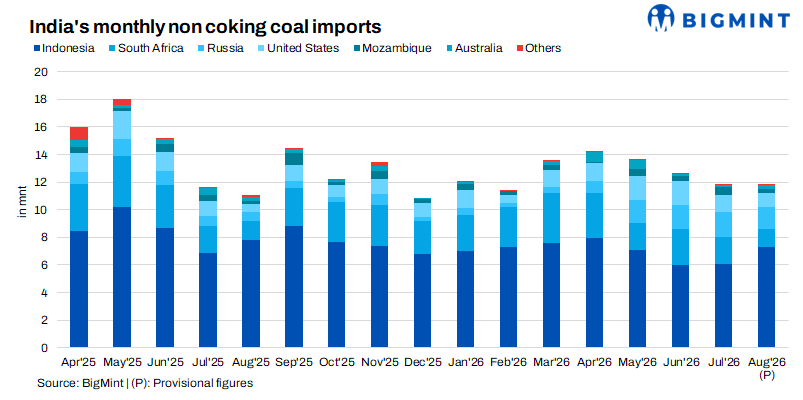
- Imports rise 6% y-o-y in Aug amid domestic supply constraints
- Power plants’ coal stocks fall sharply by 23% m-o-m in Aug
- High prices, preference for domestic coal limit imports Apr-Aug
India’s non-coking coal imports declined 11.1% y-o-y to 63.79 million tonnes (mnt) during April-August 2026, according to BigMint’s vessel line-up data, as domestic coal continued to meet a larger share of rising thermal coal demand. Imports from Indonesia and South Africa, the two largest suppliers, fell 18.1% y-o-y and 19.4% to 34.39 mnt and 10.94 mnt, respectively.
The decline, however, has started to moderate. Imports increased 6.1% y-o-y to 11.51 mnt in August, following a 2% increase in July, as higher electricity demand, weaker hydropower generation, and falling coal stocks at power plants increased the need for imported fuel. The August increase was led by the power sector, rather than a broad recovery across industrial consumers.
Imports fall in Apr-Aug as domestic coal helps meet power, industrial demand
The fall in imports during the first five months of FY’27 was primarily driven by greater reliance on domestic coal rather than weaker thermal coal demand.
Prices of Indonesian coal, which is primarily used by the power sector and accounts for over half of Indian imports, have climbed higher y-o-y, driven by tighter supply amid lower production quotas. Indonesian 4200 GAR coal prices have averaged $61/t FOB Kalimantan in CY’26 (till mid-September), 33% higher compared to $46/t in CY’25.
Elevated freights and a weaker rupee have also lifted delivered costs and reduced Indonesian cargoes’ competitiveness against domestic coal. Indian portside prices of 4200 GAR have averaged INR 7,900/t ex-Kandla so far in CY’26, up 34% compared to INR 5,900/t in CY’25.
As such, power utilities preferred domestic coal due to easier availability and lower costs. Coal India Limited (CIL) dispatched 322.85 mnt of coal during April-August 2026, up 6.7% y-o-y, despite a 4.5% drop in production. Additionally, dispatches from captive and commercial coal mines also increased 6% to 89.19 mnt during the same period.
The impact is visible in the relationship between electricity generation and imports. Coal-fired generation increased 10% y-o-y to 590.97 billion units during the first five months of FY’27, while total power generation also rose 10%. Yet non-coking coal imports fell 11.1%.
This indicates that higher thermal power demand has not translated one-for-one into higher seaborne coal requirements. Domestic coal has absorbed most of the increase so far.
South African imports also remain under pressure in Apr-Aug
Sponge iron producers reduced the proportion of South African coal in their charge mix during April-August 2026 as domestic coal availability remained strong and imported coal became expensive.
South African RB2 prices delivered to India rose sharply earlier in the year before easing during the monsoon. However, prices remained high enough to limit broad-based buying. Prices of 5500 NAR South African coal have averaged INR 11,000/t ex-Paradip so far in CY’26 compared to INR 8,300/t in CY’25, a 33% rise.
Meanwhile, India’s sponge iron production increased by 1% to 25 mnt, as per provisional data with BigMint. Evidently, limited domestic coal availability in recent months (July-August), coupled with rising pellet costs, pushed producers to curb production.
Russian, US shipments buck trend
At the same time, Russian imports rose 73.1% y-o-y to 7.61 mnt during April-August, while US imports increased 5.9% to 6.9 mnt.
Russian coal retains a relative freight advantage because of its proximity to India. US coal has remained competitive for some cement producers because of its calorific value and its ability to compete with petcoke on delivered energy economics.
Strained domestic coal logistics increases imports in Aug’26
India’s stronger power demand and lower hydro generation increased reliance on coal-fired generation in August, lifting coal imports as domestic deliveries failed to keep pace with plant consumption.
Total electricity generation rose 11.6% y-o-y to 179.97 TWh, while coal-based generation increased 11.2% to 113.68 TWh. Renewable generation rose 42.1% to 35.15 TWh, but hydro output fell 16.7% to 21.52 TWh. Average daily maximum power demand increased 13.1% y-o-y to 243.5 GW, with the monthly peak reaching 258.3 GW, against 229.7 GW a year earlier.
More importantly, the import increase points to a logistics and delivery gap rather than simply higher national coal demand. Power plants received 70.88 mnt of coal in August against consumption of 79.35 mnt, leaving an 8.47 mnt shortfall. Plant inventories fell about 23% during the month to 29.12 mnt from 37.83 mnt, while the number of critical plants rose from 30 to 51.
This was because domestic logistics remained constrained. The volume of coal moved to power plants by rail fell 6.2% m-o-m to 53.93 mnt in August, while total domestic coal movement declined 3.9%. In contrast, imported coal movement increased 4.7% to 6.84 mnt.
Outlook
In September-October, India’s non-coking coal imports are likely to remain above the levels seen earlier in CY’26, but the August increase is unlikely to develop into a broad-based recovery.
The key risk is no longer only power demand but whether the domestic coal and railway network can meet higher utility consumption while also rebuilding depleted stocks and continuing to supply industrial consumers.
During 1-13 September, coal receipts covered only 85.8% of consumption, while plant inventories fell 15.2% to 24.28 mnt. This creates scope for further Indonesian purchases by utilities, particularly given that hydro generation remains weak and electricity demand continues to be elevated.
Moreover, South African coal imports are likely to recover as domestic coal availability remains limited for sponge iron producers. US and Russian coal should also retain demand from cement producers where their delivered economics remain competitive with petcoke and domestic coal.
The September vessel pipeline already points to higher import activity, with around 7.5 mnt of non-coking coal either recorded or identified in the visible pipeline by mid-month. Indonesia remains the largest source, but considerable South African, US, and Russian cargoes are also expected.
Leave a Reply