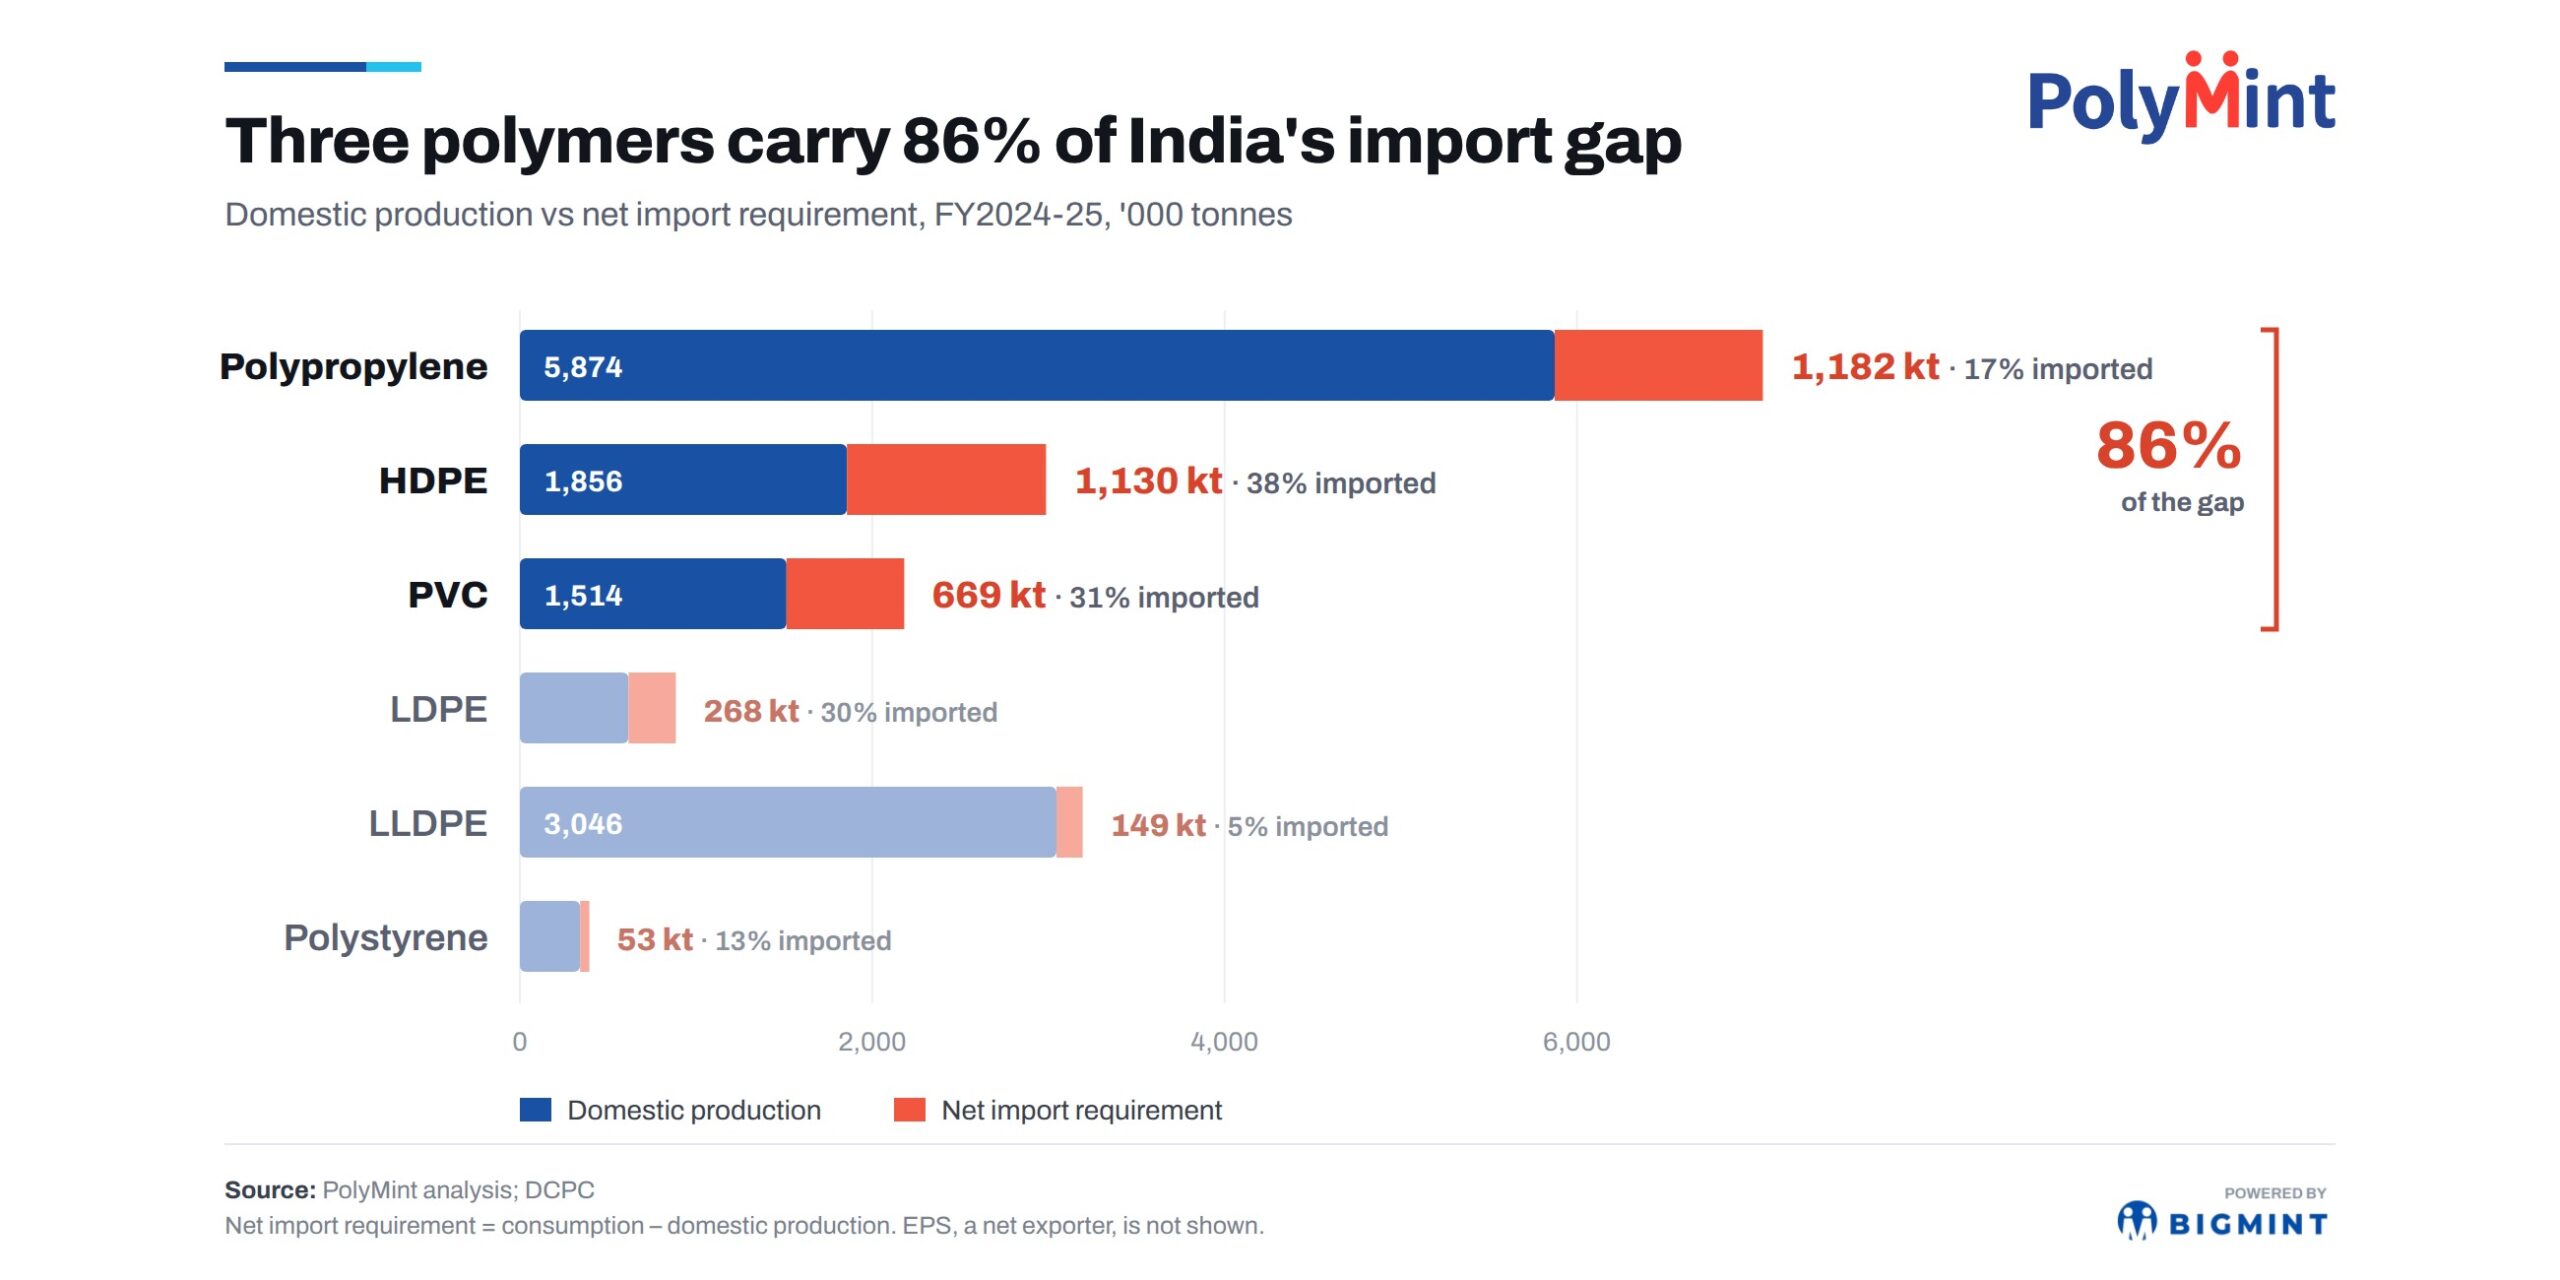
- HDPE most import-dependent at 38%; PVC 31%, PP 17%
- PP, HDPE, PVC make up 86% of India’s 3.45 mt import gap
India’s polymer import gap is concentrated across three key products, with each facing a different supply challenge. The first infographic shows where the FY25 gap sits by polymer, while the second tracks how quickly the PP and HDPE shortfall has rebuilt since new capacity briefly narrowed it in FY21.
Policy and projects are already responding
On Polyvinyl Chloride (PVC), the government moved in July 2026. The Directorate General of Foreign Trade (DGFT) placed suspension-grade PVC imports priced at or below USD 0.766/kg Cost, Insurance and Freight (CIF) under restriction for six months, exempting Export Oriented Units (EOUs), Special Economic Zones (SEZs) and Advance Authorisation imports.
This followed the Directorate General of Trade Remedies (DGTR)’s August 2025 final findings, which recommended five years of anti-dumping duty on Suspension-grade PVC (S-PVC) from seven countries.
On polyolefins, Bharat Petroleum Corporation Limited (BPCL) awarded contracts for 550,000 tonnes/year of Polypropylene (PP) and a 1.15 million tonnes/year (mnt/year) High-Density Polyethylene (HDPE)/Linear Low-Density Polyethylene (LLDPE) complex at Bina. Hindustan Petroleum Corporation Limited (HPCL)’s Barmer complex adds PP and a Polyethylene (PE) swing unit.
The open questions for buyers are what the PVC floor price means for landed costs, and how soon new PP and PE volumes actually reach the market.
Where the gap actually sits
PP is India’s largest polymer, with 5.87 mnt of domestic output in Financial Year (FY) 2025, but it still needed 1.18 mnt of imports. HDPE imported a similar volume, 1.13 mnt, on a far smaller base of 1.86 mnt, leaving it 38% import-dependent. PVC added 669,000 tonnes to the import requirement against domestic production of 1.51 mnt.
The causes differ. PP and HDPE are scale problems: demand has outgrown cracker and polymer capacity. PVC is a structural feedstock and trade-remedy story. LLDPE, with only 5% import dependence on 3.05 mnt of output, shows what closing the gap looks like.
A shortfall that rebuilt quickly

New PP and PE capacity cut the combined PP and HDPE shortfall to about 0.4 mnt by FY21. It then climbed to 1.2 mnt in FY22 and jumped to 2.9 mnt in FY23, when domestic output of both polymers dipped while demand continued to grow, before peaking at 3.2 mnt in FY24.
Record PP production of 5.87 mnt brought the combined shortfall down to 2.3 mnt in FY25, but that is still almost double the FY22 level. Without new plants, continued demand growth could quickly rebuild the deficit.
Why this matters in Ahmedabad
Where is polymer supply heading — and what could it mean for PP, PE and PVC prices, sourcing, and margins?
At PLAST.CONNECT 2026 — West India, PolyMint will bring together industry stakeholders to discuss upcoming capacities, supply gaps, resin sourcing, import parity, and pricing.
The Raw Materials & Virgin Polymers panel will examine how new capacities and PVC trade measures could reshape supply, landed costs, and buyer decisions.
Join us on 22 October in Ahmedabad and be part of the conversation shaping the polymer market.

Leave a Reply