- Scrap trade growth outpaces 5% rise in global SS output
- China, Italy drive stronger cross-border scrap flows
- Nickel uncertainty increases strategic value of scrap
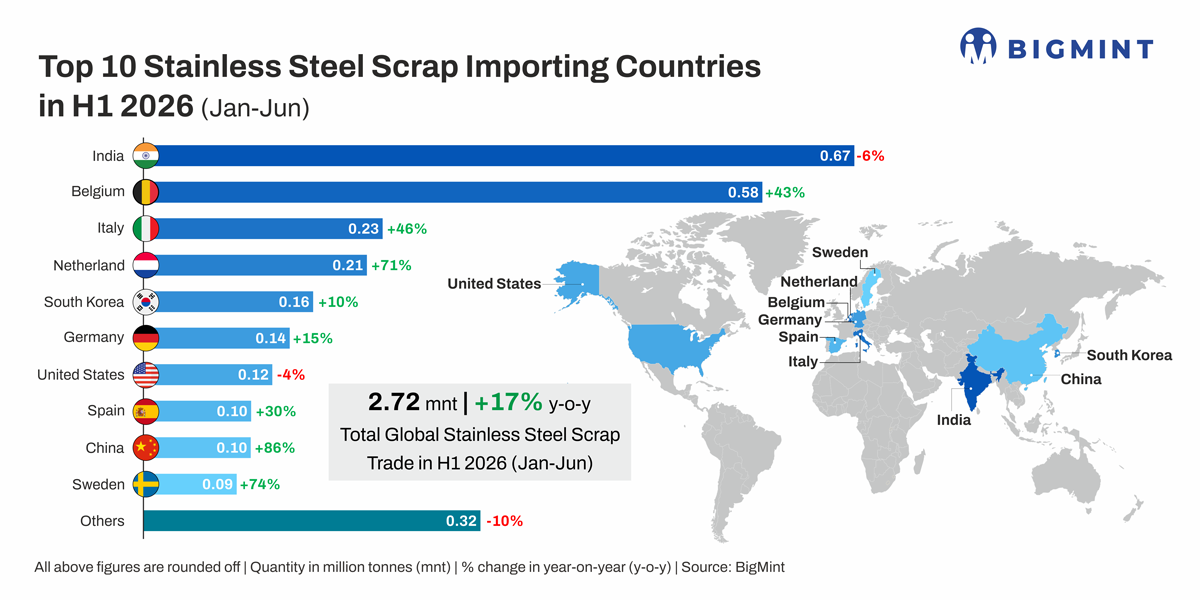
Morning Brief: Global seaborne stainless steel scrap trade flow increased 17% y-o-y to 2.72 mnt in H1CY’26 from 2.33 mnt in H1CY’25, according to BigMint data. The increase was significantly faster than global stainless steel production, which rose 5% y-o-y to 32.96 mnt from 31.40 mnt.
The divergence indicates that higher scrap trade is not being driven by stainless production growth alone. Procurement economics, regional availability, changing trade flows and uncertainty over nickel supply are increasingly influencing the choice between imported scrap, domestic scrap, semi-finished stainless steel products and primary nickel-bearing units such as nickel pig iron (NPI).
Production growth concentrated in Asia
Global stainless steel production increased by 1.56 mnt y-o-y in H1CY’26. China accounted for most of the increase, with production rising 7% y-o-y to 21.07 mnt from 19.66 mnt.
Production in Asia excluding China and South Korea increased 6% to 28.31 mnt from 26.69 mnt. US production rose 3% to 1.15 mnt, while output in other regions increased 3% to 0.60 mnt.
Europe was an exception, with stainless production declining 4% y-o-y to 2.91 mnt from 3.02 mnt.
The contrast with scrap trade is significant. Major-market seaborne scrap imports increased 0.39 mnt, or 17%, while global stainless production increased 1.56 mnt, or 5%. Scrap trade therefore expanded more than three times as fast as production, pointing to a change in the geographical distribution and sourcing of secondary raw materials.
India: Imports decline as delivered economics gain importance
India’s stainless steel scrap imports declined 6% y-o-y to around 0.67 mnt during January-June 2026, compared with 0.71 mnt in the corresponding period last year.
The decline does not necessarily indicate weaker structural scrap consumption. India’s stainless scrap imports during FY26 were estimated at around 1.4 mnt, up 7% y-o-y.
Instead, the H1 decline points towards greater sensitivity to delivered economics. Higher freight costs, currency movements, geopolitical disruptions and volatile nickel prices encouraged mills and processors to adopt more requirement-based purchasing.
The US remained India’s largest supplier during H1CY’26, with shipments of around 0.09 mnt, up 4% y-o-y. Meanwhile, supplies from some Middle Eastern and Southeast Asian origins weakened amid logistical constraints.
India’s experience therefore highlights a broader shift in scrap procurement. Import volumes are increasingly determined by the delivered-cost gap between domestic and overseas material rather than stainless steel production growth alone.
Key factors behind India’s scrap import decline
Domestic scrap becomes competitive
Higher international scrap prices and elevated logistics costs reduced the competitiveness of imported material during H1CY’26. Imported 304-grade stainless steel scrap averaged around $1,410-1,450/t, approximately $100-130/t higher than the previous year.
By June, import offers had increased to around $1,540-1,550/t. After factoring in freight, customs duty, port handling and clearance costs, the landed price remained significantly above domestic material.
In comparison, domestic 304-grade stainless steel scrap was trading around INR 144,000/t, making local procurement more economical and discouraging fresh import bookings. This shift towards domestic sourcing was particularly evident as buyers remained cautious about committing to high-priced imported material.
Semi-finished imports change raw material sourcing pattern
India’s stainless steel semi-finished imports recorded mixed trends during H1CY’26. Billet imports increased 30% y-o-y to 0.03 mnt, from 0.02 mnt, while slab imports were reported at around 0.17 mnt.
Indonesia remained a major supplier of semi-finished material, highlighting continued dependence on imported feedstock for downstream processing.
The increase in billet imports suggests that some processors may have substituted part of their raw-material requirement with semi-finished stainless steel rather than relying entirely on scrap-based production. This may have reduced incremental demand for imported scrap, although the extent of substitution would depend on individual mill production routes.
Import pattern shifts towards finished products
India also recorded significant imports of finished stainless steel products, with HRC imports estimated at around 67,000 t during April-July 2026.
The trend indicates a gradual shift in import composition towards finished material to meet domestic consumption requirements. Higher finished-product availability through imports may have reduced the requirement for additional domestic melting and scrap-based production for some downstream applications.
China’s scrap imports rise faster than production
China’s stainless steel scrap imports surged 87% y-o-y to around 101,254 t in H1CY’26, while June imports increased 146.9% y-o-y to 22,322 t.
The increase significantly outpaced China’s 7% growth in stainless steel production, which reached 21.07 mnt during H1.
Japan remained China’s largest supplier, accounting for roughly half of H1 imports, while Thailand and Malaysia also emerged as important sources.
The increase comes against expectations of tighter Indonesian nickel supply. Indonesia’s 2026 nickel-ore mining quota was set at around 260-270 mnt, materially below the approved 2025 quota, increasing concerns over nickel availability.
For stainless producers, nickel-bearing scrap provides a secondary source of nickel units. This could increase its strategic value when primary nickel-bearing raw materials face supply uncertainty.
However, China’s H1 imports remain small compared with India’s 0.67 mnt. The latest increase should therefore be viewed as an emerging procurement trend rather than evidence of a structural transformation in China’s raw-material mix.
If elevated monthly imports continue through H2CY’26, China could increasingly compete with traditional Asian buyers for higher-quality nickel-bearing scrap.
Europe: Italy increases scrap imports despite lower output
Italy’s stainless steel scrap imports increased 46% y-o-y to around 0.23 mnt in H1CY’26, while Germany’s imports rose 15% to approximately 0.14 mnt.
This is notable because European stainless steel production declined 4% during the period. Italy’s higher scrap imports therefore point towards changes in raw-material sourcing and regional redistribution rather than simply stronger regional stainless output.
Italy’s reliance on scrap-intensive electric-arc-furnace production supports demand for secondary raw materials. Germany remained Italy’s largest supplier, with shipments rising around 40% y-o-y to approximately 0.11 mnt.
The stronger German-to-Italy flow highlights the importance of intra-European scrap movement. Italy’s government has also introduced financial incentives encouraging stainless flat producers to prioritise scrap-based production, potentially supporting scrap demand through 2028.
Higher import volumes should therefore not automatically be interpreted as a broad European demand recovery. The trade data instead suggests that available scrap is increasingly moving towards competitive EAF-based stainless production.
US domestic supply limits import dependence
US stainless steel scrap imports declined around 4% y-o-y to approximately 0.12 mnt in H1CY’26, despite US stainless production increasing 3% to 1.15 mnt.
The divergence suggests that higher domestic stainless output did not translate into greater dependence on imported scrap. The US benefits from a mature domestic scrap collection and processing network, reducing its structural requirement for overseas material.
This also demonstrates why global seaborne scrap trade can increase even when imports decline in developed markets. Incremental demand in China and stronger regional flows in Europe can more than offset weaker import requirements in markets with greater domestic scrap availability.
Scrap trade growth reflects changing raw material strategies
The H1 data points to three different procurement dynamics.
Asia is becoming more selective India’s imports declined as domestic scrap became more competitive, while China’s imports increased sharply from a low base as buyers expanded access to international scrap.
Europe is redistributing scrap within the region. Italy’s higher imports and stronger German shipments indicate greater movement of secondary raw materials towards EAF-based stainless production despite lower overall European output.
Nickel availability is becoming a strategic consideration. Expectations of tighter Indonesian nickel supply could increase the value of nickel-bearing stainless scrap as an alternative source of nickel units.
The production data reinforces this conclusion. Global stainless output increased 5%, but major-market seaborne scrap imports rose 17%. The faster growth in scrap trade suggests that changes in sourcing patterns are becoming an increasingly important driver of international scrap flows.
Outlook
H2CY’26 is likely to remain sensitive to the relative economics of stainless scrap, nickel/NPI and semi-finished stainless products.
For India, the key variable is likely to remain the delivered-cost gap between domestic and imported scrap after freight and other landed costs. A wider domestic cost advantage could continue to limit overseas procurement even if stainless steel production remains firm.
For China, sustained monthly imports would be required to establish whether the H1 surge represents more than a low-base recovery. Continued growth could increase competition for high-quality nickel-bearing scrap across Asian markets.
In Europe, scrap demand is likely to remain linked to EAF utilisation, finished steel demand and the evolving impact of CBAM and trade safeguards.
Leave a Reply