- Resilient LME prices support smelting activity
- Capacity additions in H1CY’25 remain modest
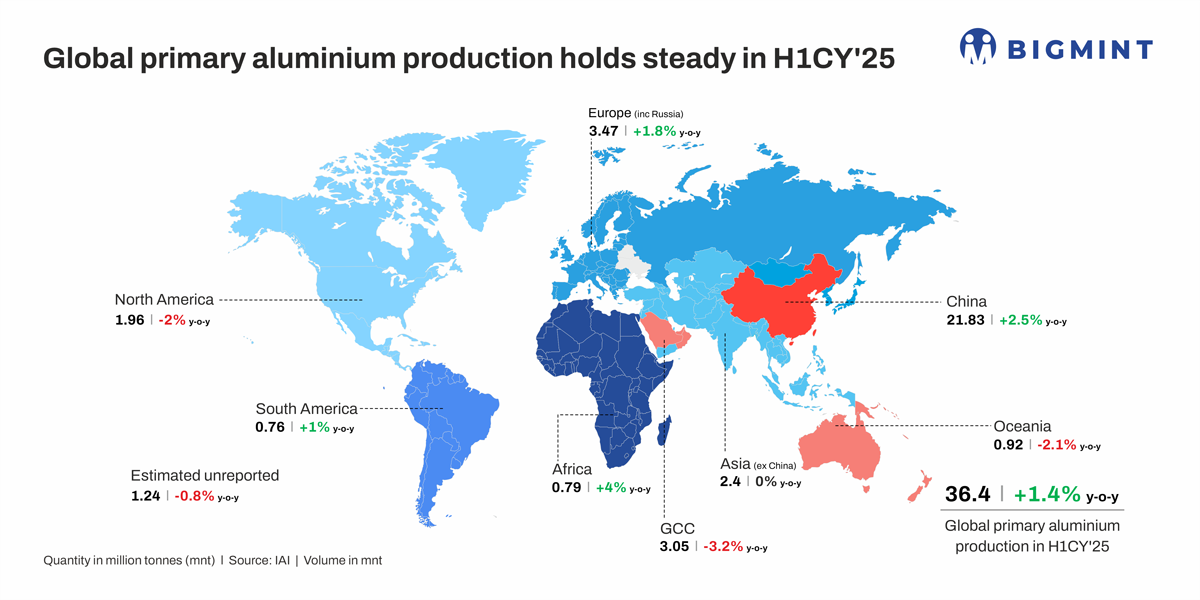
Global primary aluminium production was largely steady y-o-y in H1CY’25, recording a marginal uptick of 1.4% y-o-y, despite persistent macroeconomic challenges, trade frictions, and input cost volatility. Strong price support from the London Metal Exchange (LME) — with levels ranging within $2,499-2,593/tonne (t) — helped maintain smelting momentum globally, even as rising alumina costs (above $363/t) trimmed margins. China continued to lead among producers, while emerging regions also gained ground.
According to the International Aluminium Institute (IAI), H1CY’25 production totalled 36.4 million tonnes (mnt), up from 35.9 mnt in H1CY’24.
Quarterly output in Q2 (18.3 mnt) was 1.26% higher than Q1CY’25 (18.1 mnt), showing a steady operational pace. On a y-o-y comparison, Q2CY’25 was up 1.6% from Q2CY’24 levels.
June sees production dip: Seasonal slowdown, not alarming
June 2025, with 30 calendar days, saw a 3.3% m-o-m decline in global primary aluminium production — to 6.04 mnt from 6.25 mnt in May. While some may view this as a warning sign, it aligns with a seasonal slowdown typical of past years. In June 2024, for instance, output also fell 2.4% m-o-m.
This year, the slowdown touched all major regions, including China and Africa. However, the consistency of this June dip over multiple years points to cyclical patterns rather than structural weakness.
China maintains leadership in global aluminium production
China continued to lead the global aluminium sector, contributing nearly 60% of world output. In H1CY’25, the country produced 21.83 mnt of primary aluminium, up 2.5% y-o-y from 21.3 mnt. Q2 output stood at 10.9 mnt, rising slightly from both Q1CY’25 (10.831 mnt) and Q2CY’24 (10.71 mnt).
Production remained robust despite government-imposed capacity ceilings of 45 mnt per year. Capacity relocation projects — like the movement of smelting assets from Shandong to Yunnan — temporarily impacted monthly volumes but are part of China’s broader push for efficiency and environmental compliance.
Emerging regions gain momentum
While established producers saw output stabilise or dip, less prominent regions showed strong performance.
Africa’s output in June rose to 133,000 t, from 129,000 t in the year prior. South America’s output stood at 127,000 t in June, up from 125,000 t and in H1CY’25 to output reached 0.76 mnt, a marginal 1% rise y-o-y. Guinea, Africa’s bauxite-rich nation, also leveraged its resource base to boost domestic aluminium production. H1CY’25 output rose 4% y-o-y to 796,000 t, driven by upstream investment and government policy to build out local refining and smelting capacity.
South America, meanwhile, benefited from improved hydropower availability. Brazil’s Albras and Argentina’s Aluar ramped up production, supported by a cleaner and more stable energy environment. The continent’s 183 GW of installed hydropower capacity and 712 TWh of annual generation provide the foundation for long-term aluminium growth.
Demand shows regional variations, China logs slight growth
Overall demand showed regional variability, with China’s consumption growing around 2% in 2025, driven by the electric vehicles and photovoltaics segments. Economic stimulus in China and interest rate cuts in key economies helped support consumption, yet US industrial activity faced pressures from tariffs, and European demand remained subdued amid environmental regulations and possible Russian sanctions tightening supply.
H1CY’25 saw aluminium price volatility due to trade war uncertainties; however, prices stayed resilient. Downstream demand was generally weak in Asia but bolstered by the automotive and green tech sectors. Chinese spot aluminium prices rose 2.6% y-o-y, reflecting these dynamics.
Mill expansions, new capacity
In H1CY’25, global primary aluminium capacity additions remained modest, with no major greenfield smelters commissioned. Output growth was primarily driven by brownfield expansions and restarts. In Europe, TRIMET Germany completed ramp-ups at its Essen, Voerde, and Hamburg smelters, adding around 50,000-70,000 t.
India saw incremental gains of 100,000-150,000 t from new potlines at Vedanta’s Jharsuguda and Hindalco’s Aditya plants.
In Indonesia, minor output (<50,000 t) came online as Press Metal and PT BAI initiated upstream ramp-ups, with most volumes expected later. No significant new meltshop capacities were reported in the US, Russia, China, or the Middle East, where increases were mostly from operational optimisations.
Overall, H1CY’25’s global production growth stemmed from incremental additions at existing sites.
Trump-era tariffs impact global landscape in H1CY’25
The US administration raised aluminium import tariffs to 25% by March 2025 and which were subsequently doubled to 50% by June, escalating trade tensions and disrupting global flows. Canadian producers, hit hardest, redirected exports to alternative markets.
US domestic aluminium premiums soared, increasing over 54% and more than doubling in 2025 so far, squeezing US manufacturers and consumers. Trade flow rerouting affected Canada, the EU, and India — which have challenged the US tariffs at the WTO.
These tariffs also triggered retaliatory measures from China and others, contributing to supply chain decoupling and increased market uncertainty. While some bilateral agreements eased tensions temporarily, the tariff landscape continues to influence investment decisions and market dynamics globally.
Outlook
Looking ahead, the global primary aluminium market appears stable but poised for gradual rebalancing. China’s dominance remains intact, but countries such as Guinea, Brazil, and Argentina are carving out a larger role in global supply. Hydropower availability, local policy shifts, and upstream integration are creating pockets of strength outside traditional hubs.
While rising alumina prices and trade disruptions may weigh on margins, regional diversification and resource-backed strategies could reshape the aluminium map in the second half of 2025.
Leave a Reply