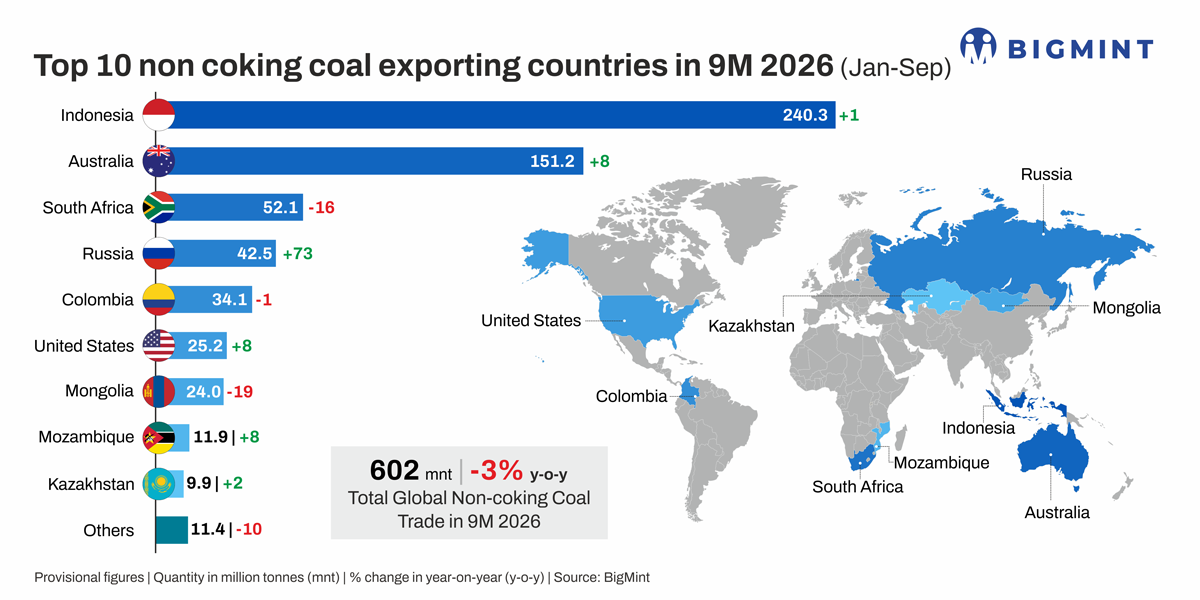
- Global trade falls 3% to 602.5 mnt in Jan-Sep’26
- South Korea gains importance as China, India routes contract
- Russian shipments to India surge, exceeding CY25 total
Morning Brief: Global non-coking coal trade declined 3.2% y-o-y to 602.5 mnt during January-September 2026, compared with 622.6 mnt a year earlier, according to BigMint’s latest trade data.
The contraction was concentrated in Indonesia and Russia. Their combined exports fell by 37.6 mnt, exceeding the overall market decline of 20.1 mnt. Growth from Mongolia, South Africa, Australia and Colombia provided a substantial offset.
The destination mix also changed. Disclosed routes to China and India contracted, while South Korea increased purchases from several suppliers. India bought less Indonesian coal but more Russian and Mozambican material.
The market is therefore becoming more differentiated by origin, destination and fuel requirements. Lower aggregate trade does not mean every importing market is weakening — or that available cargoes are becoming cheaper.
Indonesia and Russia account for the largest losses
Indonesia remained the largest exporter, accounting for approximately 40% of recorded trade. However, its share declined from 43% a year earlier. Australia’s share increased to approximately 25%, while South Africa overtook Russia in the exporter ranking.
Excluding Indonesia and Russia, recorded trade increased by approximately 17.5 mnt. The overall decline therefore conceals expansion across much of the remaining supplier group.
Indonesia loses volumes to India and China
Indonesian exports declined 10.4% to 240.3 mnt. Shipments to India fell by 14.2 mnt to 63.8 mnt, while China-bound volumes declined by 8.8 mnt to 41.1 mnt. Together, these routes accounted for approximately 82% of Indonesia’s net export reduction.
Vietnam-bound shipments also fell, declining by 4.1 mnt to 16.2 mnt. Supplies to the Philippines were broadly steady at 28.3 mnt. South Korea provided an offset, increasing purchases by 2.3 mnt to 22.7 mnt.
The pattern shows that Indonesian exports did not weaken uniformly. Procurement shifted between customers even as total shipments contracted. Production approvals, domestic requirements and loading conditions remain relevant to supply availability. However, the trade figures alone cannot separate their effects from buyer decisions, inventories and shipment timing.

Australia grows as South Korea offsets weaker Chinese purchases
Australian non-coking exports increased 2.1% to 151.2 mnt, supported principally by South Korea.
South Korean purchases rose by 7 mnt to 17.4 mnt, more than the increase in Australia’s total exports. Taiwan added 1.7 mnt, while Japan increased purchases by 1.4 mnt.
These gains offset a 4.2 mnt reduction in China-bound shipments and a 1.6 mnt decline to Vietnam. Japan remained Australia’s largest disclosed customer at 52.2 mnt, followed by China at 40.8 mnt.
Australia’s performance illustrates how changing customer demand can sustain an exporter even when a major route contracts. It does not establish that all Australian grades are readily substitutable for Indonesian coal: energy content, ash, moisture and delivered cost remain important.
South Korea becomes a stronger destination
Across the individually disclosed supplier routes, South Korea’s purchases increased from approximately 39.3 mnt to 50.2 mnt, a rise of nearly 28%. Australia contributed the largest increase, followed by Indonesia and South Africa. Lower Colombian shipments provided a partial offset.
South Korea became a larger destination for several exporting countries while their China- and India-bound routes weakened.
Trade data establish the purchasing shift, but generation, inventories and competing-fuel economics would be needed to explain its precise causes.
Russia redirects more coal to India
Russian exports declined 18.6% to 42.5 mnt.
The largest reductions were to Türkiye, down 7.5 mnt to 15.7 mnt, and China, down 5.3 mnt to 15.1 mnt. India moved in the opposite direction. Russian shipments increased by 3.7 mnt to 9.6 mnt, already exceeding the 7.4 mnt recorded for the whole of CY25.
India consequently accounted for approximately 23% of Russia’s recorded exports, compared with 11% a year earlier. This represents a meaningful diversification of Russia’s customer mix. However, India’s growth was insufficient to offset losses on the larger Turkish and Chinese routes.
India buys less on disclosed routes, but diversifies
India’s individually disclosed supplies declined approximately 9.7% to 107.7 mnt from 119.3 mnt.
Indonesia’s share of these identified supplies declined from approximately 65% to 59%. Russia’s increased from 5% to 9%. The reduction should not be interpreted as equivalent weakness in Indian fuel consumption. Our power-sector monitoring shows higher coal-fired generation and substantial inventory drawdowns.
Imports, domestic supply and stocks can move differently. Coal quality, delivered economics and consumers’ ability to obtain domestic supplies also influence procurement.
South Africa and Colombia find growth outside their largest routes
South African exports increased 7.6% to 52.1 mnt.
India remained its largest disclosed destination at 22.2 mnt, although purchases were slightly lower. Pakistan drove much of the growth, increasing shipments from 2.9 mnt to 6.8 mnt. South Korea also expanded substantially.
Colombian exports rose 7.9% to 34.1 mnt. Brazil increased purchases by 1.7 mnt to 3.6 mnt, while the Netherlands added 0.7 mnt. US exports were broadly steady at 25.2 mnt. Higher Netherlands-bound shipments offset part of the declines to India, Morocco and Egypt.
Growth in Netherlands-bound trade indicates stronger deliveries into a European trading and distribution hub; it should not automatically be equated with final Dutch consumption.
Full-year trade depends on fourth-quarter performance
CY25 trade totalled 856.3 mnt, including approximately 233.7 mnt during October–December. Two mechanical comparisons illustrate the possible scale of CY2026:
Repeating CY2025’s fourth-quarter volume would produce approximately 836.2 mnt, down 2.3%.
Applying the nine-month decline rate to CY2025’s annual total would produce approximately 828.7 mnt, down 3.2%.
These are reference calculations, not independently modelled forecasts. Seasonal buying, domestic production, inventories, weather and loading conditions will determine the outcome.
Global non-coking coal trade is contracting, but the adjustment is concentrated and uneven. For buyers, lower global volumes offer no automatic assurance of cheaper fuel. Availability by grade, origin, loading location and delivery period will continue to determine procurement costs and fuel security.
Leave a Reply