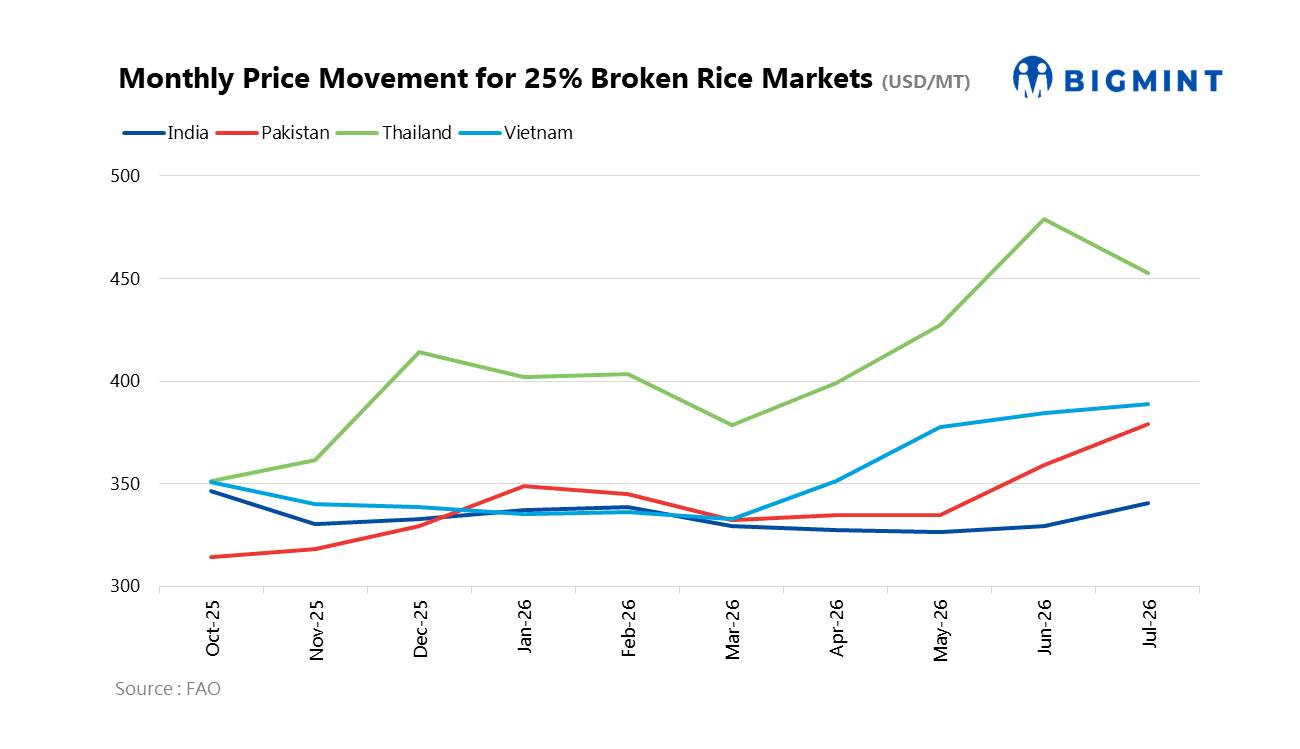
- Asian markets show mixed trends, with firmer values in India, Vietnam
- Indica remains rice only major segment to record m-o-m increase
The FAO All Rice Price Index averaged 108.4 points in July 2026, virtually unchanged from June but 4.7% higher than a year earlier. Indica quotations increased by 0.6%, supported by demand, while export prices in the other market segments declined.
The Indica Index rose to 110.8 points in July from 110.1 in June and 106.6 in July 2025. The Aromatic Index declined to 104.9 points from 105.5 in June, while the Japonica Index fell to 95.2 from 96.6. The Glutinous Index decreased to 95.5 from 99.8.
Indian rice prices rise on African demand
In Asia, export prices of Indica rice were generally firmer in July, except in Thailand, where low demand and baht depreciation caused prices to give back some of their gains recorded in June.
In India, quotations drew support from robust sales to African buyers, especially for parboiled rice, despite a weaker rupee.
India 5% rice was quoted at $357.9/mt in July, up 3% from June but down 4% from a year earlier. Indian parboiled 5% rose 5% m-o-m to $356.9/mt, although it remained 6% below its year-earlier level.
The January-July 2026 average stood at $347.9/mt for India 5%, down 10% from the corresponding period of 2025, while the average for parboiled 5% was $347.8/mt, down 13%.
India’s 25% rice quotation stood at $340.8/mt in July, with a January-July average of $332.8/mt. Meanwhile, Pusa Basmati was quoted at $1,050/mt, with its January-July average at $1,082.1/mt.
Vietnam’s rice prices reach 19-month high
In Vietnam, sentiment in the Indica and fragrant rice markets was clouded by uncertainties surrounding the issuance of import licences in the Philippines. Officials also encouraged traders to shift from sourcing 5% broken rice towards greater purchases of 25% broken rice.
Nevertheless, Vietnamese quotations reached 19-month highs, as cost-driven increases were compounded by thinning supplies against a backdrop of a delayed and reduced early summer-autumn harvest.
Vietnam 5% rice was quoted at $425.3/mt in July, up 3% m-o-m and 12% y-o-y. Its January-July average stood at $384.7/mt, down 2% from a year earlier.
Vietnam 25% rice was quoted at $389.1/mt, with a January-July average of $358.2/mt. Vietnamese Fragrant 5% rice stood at $507.1/mt, while its January-July average was $457.3/mt.
Thai rice prices decline despite higher y-o-y levels
Thailand recorded lower quotations across key rice varieties in July amid low demand and baht depreciation.
Thai 100% B White rice was quoted at $473/mt, down 5% from June but 16% higher than a year earlier. Thai Parboiled 100% rice stood at $478.4/mt, down 6% m-o-m but 18% higher y-o-y.
The January-July average for Thai 100% B White was $438.4/mt, down 1% from the corresponding period of 2025, while Parboiled 100% averaged $449.5/mt, up 1%.
Other Thai quotations also showed varied movements. Thai 25% rice was priced at $452.8/mt, while Thai A1 Super stood at $408/mt. Thai Fragrant rice was quoted at $1,203.4/mt, with its January-July average at $1,208/mt. Thai Glutinous 10% stood at $799.2/mt, compared with a January-July average of $826.2/mt.
Americas show mixed price movements
In the Americas, focus remained on supply-side factors, while reduced returns and El Niño disruptions weighed on MERCOSUR planting decisions.
Argentina 5% rice rose 1% m-o-m to $453/mt, while Brazil 5% and Uruguay 5% were broadly unchanged at $515.3/mt and $519.2/mt, respectively.
In the US 4% rice fell 1% to $527.6/mt, while Medium Grain, 4% remained at $916/mt.
Rice prices remain below 2024 levels
Several selected rice quotations remained below their July 2024 levels. Argentina 5% was down 41%, Brazil 5% 35%, India 5% and Parboiled 5% 34%, and Pakistan 5% 30%. Thai 100% B White, Thai Parboiled 100%, Uruguay 5%, US #2, 4%, and Vietnam 5% were lower by 22%, 19%, 36%, 32% and 21%, respectively.
Meanwhile, the FAO All Rice Price Index averaged 104.2 points in January-July 2026, down from 106.3 a year earlier. The Indica Index averaged 105.1, while Aromatic, Japonica, and Glutinous averaged 103.7, 97.2, and 100.5, respectively. The FAO index is based on 21 rice export quotations.
Outlook
The rice market outlook remains mixed, with price movements likely to vary across origins and rice varieties. Demand and export activity will remain important for prices, while crop prospects, planting decisions and weather conditions could influence supply expectations in the coming months. The impact of El Niño on upcoming crops will also remain a key factor to watch.
Leave a Reply