- IEX market sees sharp mid-month supply squeeze as purchase bids nearly double
- Thermal power plant coal stocks fall 6.1 mnt as coal underpins grid stability
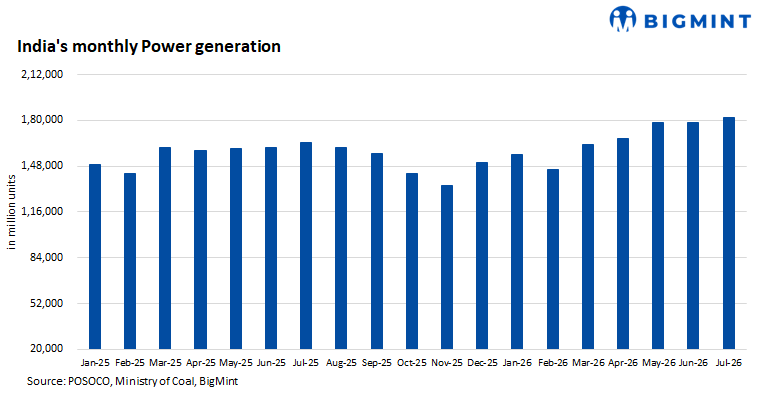
India’s electricity system moved into a markedly higher demand range in July 2026. Peak demand reached 270.2 gigawatt-hour (GW), while gross generation rose to about 181.8 terawatt-hour (TWh). Coal and renewable generation together supplied virtually the entire incremental requirement as hydro output fell sharply. The grid avoided any broad supply deficit, but the response came with higher exchange prices and a 6.1 million tonnes (mnt) drawdown in thermal power-plant coal inventories.

Demand moves decisively above the previous two Julys
India’s maximum demand met reached 270,203 MW on 16 July 2026, 22.5% above July 2025’s maximum and 19.2% above July 2024.
Gross generation rose by 10.6% y-o-y to around 181.8 TWh in July 2026, compared with growth of only 1.6% between July 2024 and July 2025. The system was therefore responding to a genuine step-up in electricity requirement rather than a statistical base effect alone.

Coal generation increased by about 13.3 TWh y-o-y, while renewable output rose by a further 8.4 TWh.
Together, the two sources generated nearly 21.8 TWh more electricity than in July 2025. The gains were partly offset by a 5.3 TWh fall in hydro generation. This is the defining feature of July 2026. A monsoon month would ordinarily be expected to bring stronger hydro output and reduce pressure on thermal generation. Instead, hydro generation was 22% below July 2025 and even lower than in July 2024.
Coal therefore had to perform two functions simultaneously: (1) meet the underlying growth in electricity demand and (2) replace electricity that would otherwise have been supplied by hydro stations.
Coal’s share of gross generation still declined marginally — from 66.5% in July 2024 to around 64.3% in July 2026 — because renewable generation expanded much faster. RES supplied almost 20% of total generation, compared with 15.1% two years earlier.
Gas did not emerge as a major balancing source. Generation from gas, naphtha and diesel declined in both absolute and percentage terms, reinforcing India’s reliance on coal and renewables.
Mid-Jul data shows why thermal flexibility remains essential
Renewable output was high across the month but weakened just as demand reached its peak.
Renewables generation reached 1,410 million units (MU) on 13 July before falling to 1,149 MU on 16 July. Over the same period, coal generation rose from 3,731 MU to 4,139 MU and increased further to 4,146 MU on 17 July.
The system therefore relied increasingly on dispatchable coal capacity during the most difficult demand window. July illustrates the emerging structure of India’s electricity transition. Renewables are supplying a growing proportion of aggregate energy, but coal plants continue to provide the flexibility required when demand rises while variable renewable output falls.
IEX: Jul’26 was tighter than 2025 but not uniformly tighter than 2024
The three-year IEX comparison adds an important nuance. July 2026 was substantially more expensive than July 2025, but its monthly average day-ahead price remained below July 2024.

IEX’s July 2024 snapshot reported 5.071 million MWh of final scheduled volume, with the average market clearing price (MCP) of INR 4,984/MWh and a maximum MCP of INR 7,164/MWh. This means July 2026 was not the most expensive July on average. Its average MCP of INR 4,410/MWh remained around 11.5% below July 2024.
However, the 2026 market displayed a far more extreme mid-month demand imbalance. Purchase bids almost doubled from July 2025 to 12.38 million MWh and were 46% above July 2024. Sell bids increased much more slowly. Consequently, aggregate purchase bids exceeded sell bids in July 2026, reversing the surplus sell-side position seen in both earlier years.

On 16 July, purchase bids were almost seven times sell bids. Yet only 125,460 MWh was scheduled, one of the lowest cleared volumes of the month. The market was therefore not simply experiencing “high demand”. It was experiencing a shortage of uncommitted, flexible supply available for sale on the exchange.
The highest scheduled volume was recorded earlier, at 223,564 MWh on 9 July, while 12 July recorded 218,011 MWh. By comparison, July 2024 experienced a more sustained high-price environment. MCP exceeded INR 6,000/MWh on several dates, and reached INR 7,164/MWh on 31 July when sell bids fell to just 174,325 MWh.
The distinction is important:
- July 2024: higher average prices and more persistent tightness;
- July 2025: relatively comfortable and low-priced;
- July 2026: moderate monthly average, but an exceptional mid-month scarcity episode.
Coal receipts, consumption: 2024 and 2025 comparison
CEA’s monthly statements show that power plants consumed slightly less coal in July 2025 than in July 2024, but receipts fell more sharply.

The CEA monthly reports cover coal receipts from CIL, SCCL, captive sources, e-auction, imports and other sources, together with consumption and closing stock. In July 2024, plants received 71.45 mnt and consumed 72.79 mnt, implying a relatively modest inventory drawdown during the month.
In July 2025, receipts fell to 64.13 mnt even as consumption remained above 71 mnt. The resulting gap exceeded 7 mnt. Yet the fleet ended the month with a higher closing stock of 53.92 mnt because it had entered July with a much larger buffer.
This helps explain why July 2025’s electricity market remained relatively comfortable despite sizeable stock consumption: the fleet had sufficient inventories to absorb the gap.
July 2026 begins with less coal and burns it faster
Comparable July 2026 monthly receipt and consumption totals cannot yet be inserted without the CEA monthly coal statement. However, the daily reports show the direction clearly.

Stocks fell by 6.10 mnt, or 13.8%, during July 2026. The month-end inventory was 15.9 mnt below July 2025 and 7.6 Mnt below July 2024 and equal to only 59% of the CEA’s revised normative requirement.
The number of critical plants initially declined from 32 at end-June to 26 on 19 July, before climbing back to 31 by month-end. CEA defines a plant as critical when its coal stock is below 25% of normative stock.
This was not a nationwide coal emergency. Most monitored plants remained above the critical threshold. But the fleet-level buffer was being depleted quickly, while several large plants remained acutely exposed.
The reports also repeatedly referred to shortfalls against subgroup supply plans, rake availability and the need for generators to improve rail programmes. These observations point to mine-to-plant logistics as a contributing constraint, but they do not prove a uniform nationwide failure by coal producers or the railways.
Three Julys, three different market structures
The expanded data reveals three distinctly different operating environments.
July 2024: higher prices despite lower demand
Demand and generation were well below 2026 levels, but the IEX average MCP was the highest of the three years. Coal consumption exceeded receipts only modestly, while closing stocks stood at 45.63 mnt.
This suggests a market with less available exchange supply and relatively persistent pricing pressure, even though the physical system was serving lower demand.
July 2025: comfortable power market, but heavy coal-stock use
Peak demand declined, hydro generation increased strongly, and IEX prices were at the lowest of the three Julys.
Coal receipts nevertheless trailed consumption by more than 7 mnt. The system absorbed that gap because power plants entered the month with a large inventory cushion, leaving closing stocks at 53.92 mnt.
July 2026: high demand, weak hydro and rapid inventory erosion
The system faced record July peak demand, 10.6% higher generation, 22% lower hydro output, 13% higher coal generation, 30% higher renewable generation, nearly 90% growth in IEX purchase bids, and a 6.1 mnt drawdown in power plant coal stocks.
The electricity system met the challenge, but the response depended on running the coal fleet harder while drawing down stocks that were already lower than a year earlier.
Outlook
The main risk entering August is not necessarily immediate coal scarcity. It is the pace at which the buffer is narrowing.
July 2025 demonstrated that a large opening inventory can absorb a sizeable receipt-consumption deficit without creating major electricity-market stress. July 2026 began with a smaller stock cushion, experienced much higher coal burn and ended with only 38 mnt at monitored plants.
A recovery in hydro output and moderation in demand would allow thermal stations to rebuild inventories. If those conditions do not materialise, coal receipts will need to rise materially above burn to prevent further stock erosion.
For India’s power market, July’s message is equally clear: renewable growth is supplying an increasing share of total energy, but the system still needs substantially more flexible capacity, storage and demand response to avoid extreme exchange imbalances when peak demand, weak hydro and lower renewable availability coincide.

Leave a Reply