- Higher consumption draws down mine, power plant inventories
- Cement output grows 11%; sponge iron production rises 3%
India’s non-coking coal market relied increasingly on accumulated inventories during April-September 2026 as production by Coal India Limited (CIL) and non-coking coal imports declined, while power-sector consumption and industrial activity increased compared with the corresponding 2025 period.
CIL sustained higher dispatches by drawing on pithead inventories. Power plants also consumed more coal than they received, depleting their own stocks. These buffers supported higher generation, but left inventories substantially lower towards the period’s close.
Meanwhile, growing cement and sponge iron production strengthened underlying industrial fuel requirements, adding to demand beyond electricity generation.

Lower production, imports meet higher requirements
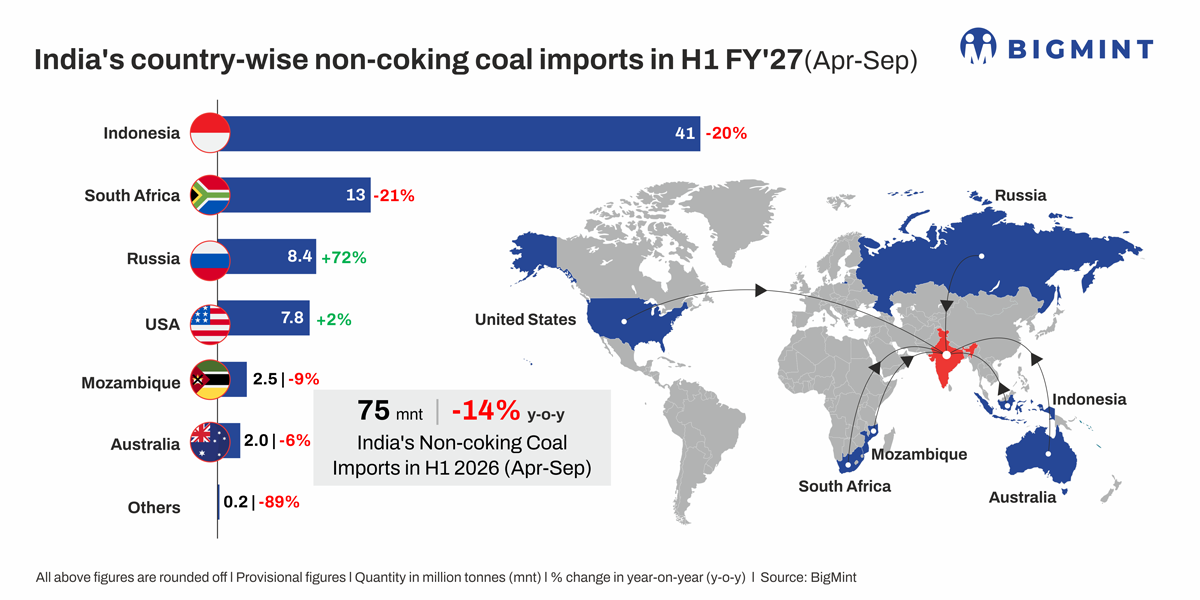
CIL’s production declined by 8.13 mnt to 320.98 mnt during April-September, while non-coking imports fell by 11.69 mnt to 74.60 mnt. Demand moved in the opposite direction. Electricity consumption increased by 91.45 TWh, or 10.2%, while coal-fired generation rose by 67.01 TWh, or 10.5%.
Actual power plant fuel consumption also increased. During April-August, coal consumption rose by 33.10 mnt to 394.60 mnt, substantially exceeding the 11.22 mnt increase in receipts. This divergence explains the greater reliance on inventories: weaker CIL output and lower imports coincided with higher consumption, requiring accumulated stocks to support ongoing supplies.

Pithead stocks sustain higher dispatches
Despite lower production, CIL increased dispatches by 25.12 mnt to 382.29 mnt. Previously mined coal helped sustain this growth in deliveries.
Official Ministry of Coal figures place overall pithead stocks at 151.96 mnt at end-March and 118.72 mnt at end-June. Extending the June balance using production and despatches gives reconstructed inventories of 101.61 mnt at end-July and 86.61 mnt at end-August. The estimated five-month drawdown was 65.35 mnt, or 43%. CIL accounted for 54.56 mnt — approximately 84% — of this reduction.
September production recovered to 53.50 mnt, but remained below despatches of 61.20 mnt. This implies another 7.70 mnt reduction, taking reconstructed CIL stocks to 67.71 mnt, 47.9% below end-March. July-September pithead balances remain estimates subject to inventory adjustments and reporting differences. Complete September figures for other producers are required to extend the national balance.
Power plants consume their own buffers
Higher domestic deliveries did not fully cover rising plant consumption.
During April-August, domestic receipts increased 3.8%, while imported receipts declined 6.1%. Combined receipts grew 3.2%, against consumption growth of 9.2%. Receipts covered 92.7% of consumption, compared with 98.1% a year earlier. The consumption-receipt gap widened from 7.02 mnt to 28.90 mnt.
The inventory trajectory reinforces this tightening. In 2025, plant stocks increased from 56.69 mnt at end-April to 61.66 mnt in June, before declining to 45.84 mnt in September. In 2026, stocks fell continuously from 53.70 mnt at end-April to 44.11 mnt in June and 21.25 mnt in September.
Between end-April and end-September, depletion reached 32.46 mnt, compared with 10.85 mnt in 2025. Including April, the 2026 drawdown from end-March was 38.04 mnt.
Weaker hydro keeps coal generation elevated
Coal supplied 68.8% of the net increase in electricity generation during April-September, retaining a broadly steady generation share of 66.4%. Renewable output increased by 43.48 TWh, but hydro generation declined by 18.43 TWh. Gas, naphtha and diesel generation also fell 7.4%.
These reductions partly offset renewable gains, leaving coal-fired plants to provide most of the additional electricity.

Industrial activity adds to fuel requirements
Cement production increased by 24.84 mnt, or 10.9%, to 252.84 mnt. September output rose 12.7% to a provisional 40.23 mnt, indicating continued growth towards the period’s close. Sponge iron production increased by 0.96 mnt, or 3.3%, to 30.41 mnt, as per provisional data maintained by BigMint.
Higher cement output supports kiln-fuel requirements, including coal and petcoke, while coal-based sponge iron production adds to non-coking coal demand. Actual coal consumption depends on cement producers’ fuel mix and the coal-based versus gas-based sponge iron production split.
Import sourcing shifts within smaller market
Indonesia and South Africa recorded the largest supply reductions. Russia moved against the trend, increasing shipments by 72.1% and nearly doubling its import share to 11.2%. US arrivals remained broadly steady. The change indicates shifting procurement within a contracting import market. National arrivals serve multiple industries and should be distinguished from imported coal receipts at power plants.
BigMint assessment
Higher consumption of non-coking coal has been supported by substantial inventory depletion at both mines and power plants, reducing the buffer available for subsequent demand.
Stronger fresh production and sustained deliveries are now needed to cover consumption while rebuilding stocks. If domestic supply cannot achieve both, imported coal requirements could strengthen. Inventory replenishment, power demand and hydro availability will therefore be central to the market’s direction in the coming months.
Leave a Reply