- Majority countries report fall in seaborne exports
- India drops to 11th* position in 2023
- Russian mills hit by sanctions, export tax
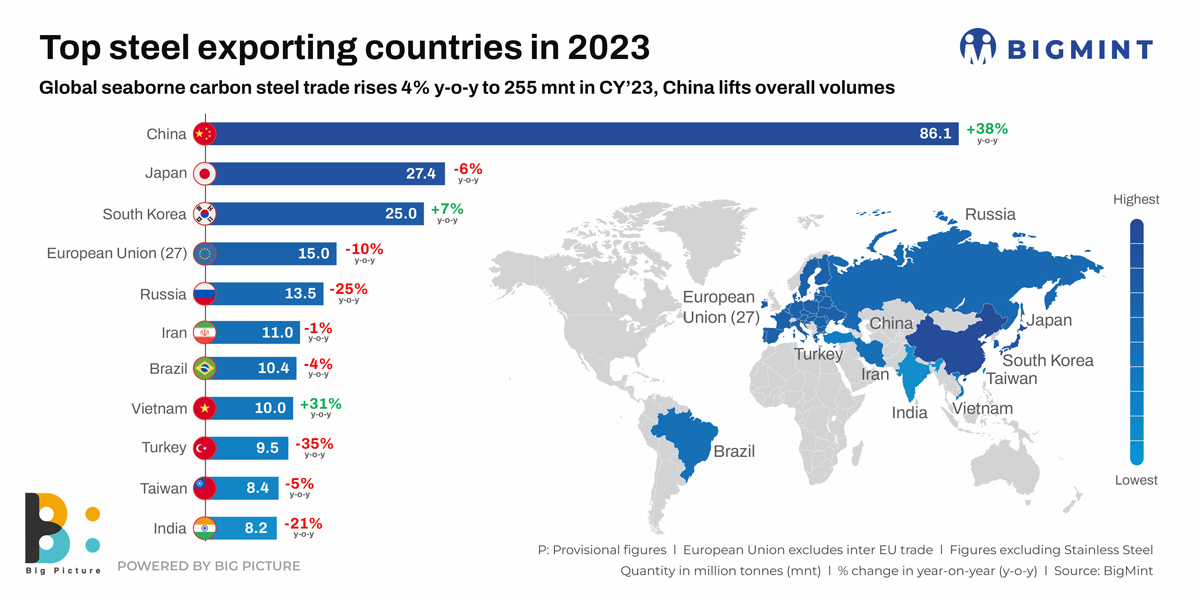
Morning Brief: Global steel exports, excluding stainless steel, rose a nominal 4% to around 255* million tonnes (mnt) provisionally in calendar 2023 (CY’23) compared to 245* mnt in CY’22, as per data maintained with BigMint. The 17* countries tracked by BigMint contribute over 90% of the global seaborne steel trade. It was China, the largest steel exporter globally, which pulled up the overall export volumes as 12 of the 17* countries showed a y-o-y decline in a scenario where high interest rates, sliding currencies, inflation, and geo-political upheavals kept demand low. The European Union figures of 17 mnt considered exclude the intra-EU trade.

Factors that influenced steel export trends in CY’23
Chinese mills challenged by higher output, slack demand: China, of course, led the global seaborne steel trade with a whopping 38% y-o-y increase to 86 mnt against 62 mnt seen in CY’22 and not without reason. First, higher crude steel production amid slack demand led to inventory glut and impelled mills to explore overseas markets. Total output in the first half was higher by 12% at 538 mnt compared to 480 mnt in the second half but y-o-y production registered a 1% increase. Secondly, demand, on the other hand, slipped 1% and real estate in particular by around 20%. Thirdly, limited home demand led to a fall in domestic steel prices and squeezed margins. Benchmark domestic HRC and rebar prices fell 11% and 12% respectively last year. Chinese mills, desperate to offload the excess inventory, aggressively lowered offers. These fell almost 16% from an average $703/t FOB in CY’22 to $594/t in CY’23. Despite the price drop, mills made money via exports because of the depreciated yuan.
Vietnam exports up amid weak domestic demand: Vietnam, the eighth-highest steel exporter globally, saw a 31% increase in the same to over 10 mnt (8 mnt in CY’22) despite its crude steel production falling 6% in CY’23. The key reason for the inflated exports lay in Vietnam’s sluggish domestic steel demand which encouraged exports to India. As per a report, Vietnam’s construction steel output was down nearly 22% mnt y-o-y in the first nine months of CY’23. Consumption was down 20%.
Hoa Phat Group, the largest steel producer in Vietnam, contributed majorly to the country’s exports. For the first time, it exported more than 1.1 mnt of HRCs in 2023 amid dull domestic demand.
Turkiye impacted by decreased EU demand: This country, like Vietnam, occupies a key position in global steel production and export markets. However, its exports fell a substantial 35% to 9.48 mnt (nearly 15 mnt in CY’22). For the full year 2023, Turkiye’s crude steel production fell 4% y-o-y to around 34 mnt, impacted by earthquake-induced disruptions in supply, and low domestic demand on the back of high interest rates, inflation and rising energy costs. But the double whammy was the decreased demand from Europe, where high energy costs took a toll on manufacturing activities.
Despite recovering, the EU auto sector is not expected to reach pre-pandemic levels even in 2024. Residential construction was affected by high interest rates, materials costs and labour shortage. Infra investment remained stable but Germany faced recession and a housing crisis.
Russia impacted by sanctions, export tax: Russia’s steel exports fell a considerable 25% to 13.50 mnt (18 mnt in CY’22) in 2023. Crude steel production was up 5.6% last year but the western sanctions majorly impacted Russia’s exports to Europe, which was its key market for several commodities, including steel. That apart, Russia slapped an export tax from October last year on all major items, including iron and steel, metals, and coal. It was to remain in force till end of 2024.
Most long and flat products, semis like billets and slabs, and steel raw materials like pig iron, iron ore, HBI, coal and coke, reportedly came within the ambit of the export duties. The duty, as per Russian authorities, was slapped “to protect local markets from unconditional increase in prices” and “support local consumption”.
Meanwhile, war-beleaguered Ukraine, which had a share of 4.5 mnt in CY’22, saw its volumes decline 36% to 3 mnt last year even as it broke the blockade of its ports by Russia on the Black Sea.
India drops to 11th* largest exporter rank: India slipped from 9th position in CY’22, to 11th* with 8 mnt (10 mnt in CY’22), a decline of 21% y-o-y. India’s poor export performance was mainly on account of two reasons. One was the good domestic demand which allowed mills the leeway to defocus from exports. Two, export offers were not viable as Chinese mills had lured away potential buyers with drastically-reduced offers. This allowed a traditional market like Vietnam to slip away from India. Domestic price realisations were higher compared to exports. For instance, in CY’23, benchmark domestic HRC prices averaged INR 57,400/t ($691/t), ex-Mumbai, minus 18% GST, whereas HRC offers averaged $628/t FOB.
Outlook
China will continue to have a strong influence on the global seaborne steel trade. Future volumes will depend on which way China’s exports wind blows — volumes may not cross 2023 levels but remain thereabout, if domestic demand fails to pick up to satisfactory levels.
Globally, interest rate cuts are expected from key central banks, which can stimulate demand and keep the global seaborne trade supported.
*Iran export numbers have been added in global seaborne trade.
