- China and DRC account for 54% of production
- India’s production grows post Adani refinery ramp-up
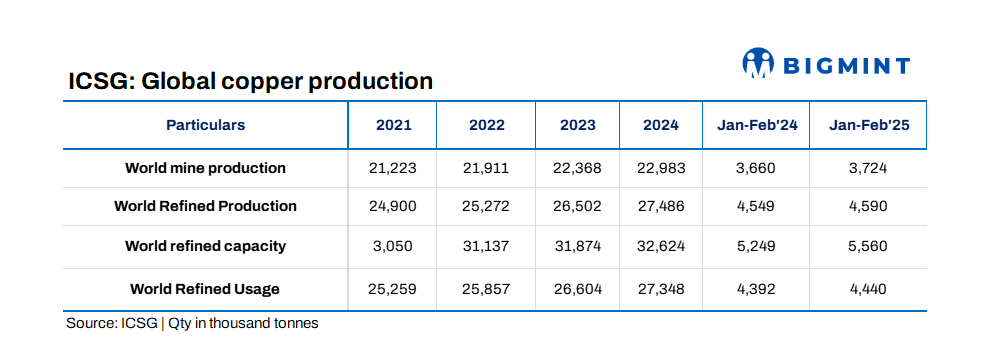
The International Copper Study Group (ICSG) has released preliminary data for January-February 2025, showing that global refined copper production increased by 1% y-o-y. This included a 0.5% rise in primary production (from ores via electrolytic and electrowinning processes) and a 3% increase in secondary production (from scrap).
The growth was largely supported by improved output in China and the Democratic Republic of Congo (DRC), which together accounted for around 54% of global refined copper output in the period. China’s refined copper production rose by approximately 2%, driven by continued capacity expansions. Meanwhile, output in the DRC also increased by around 2%, aided by smelter development and improved operational efficiencies.
Regional trends in refined copper production
Chile’s refined copper production declined sharply by 18%, with electrolytic output down 9% due to smelter maintenance and SX-EW output falling 8%. India saw notable gains due to the ramp-up of the Adani refinery. Japan’s production fell by 5%, while Asia ex-China experienced an overall increase of 6%.
Indonesia’s new projects faced delays, with Amman starting in March and Manyar aiming for mid-year commissioning.
Copper mine output rises
Global copper mine production rose by 1.7% y-o-y in the first two months of 2025, with concentrate production increasing 2.7%, while SX-EW declined by 1.7%.
Peru saw a 3.5% rise in mine output, mainly from Las Bambas, Quellaveco, and Toromocho. DRC mine output increased by 5%, supported by the expansion of the Kamoa mine. Chile’s mine output fell 4%, with declines in both concentrate (-2%) and SX-EW (-11%), mainly due to issues at Collahuasi and Codelco.
Asia and North America experienced mine output declines of 1.5% and 2.5%, respectively.
Refined copper usage and market balance
Global apparent refined copper usage increased by 1% in January-February 2025.
China’s apparent demand rose by 1.6%, though net imports dropped by 11%. World ex-China usage rose by 0.5%, driven by gains in Asia and MENA, despite weakness in the EU, Japan, and the US.
Market surplus and stocks
The global refined copper market showed a preliminary surplus of 150,000 t in January-February. When adjusted for estimated changes in Chinese bonded stocks, the surplus rises to 167,000 t. Bonded stocks in China increased by approximately 17,000 t. Total copper stocks at LME, COMEX, and SHFE reached 537,043 t at the end of March, a 25% increase from December 2024.
Copper prices
The average LME cash price for March was $9,731.67/t, up 4.3% from February. The highest price for the year was $9,982/t on 25 March, while the lowest was $8,539/t. The year-to-date average stands at $9,301.88/t, which is 1.7% higher than the 2024 average.
Leave a Reply