- Refined copper output expands, driven by China and DRC
- Exchange stocks surge as market posts sizeable surplus
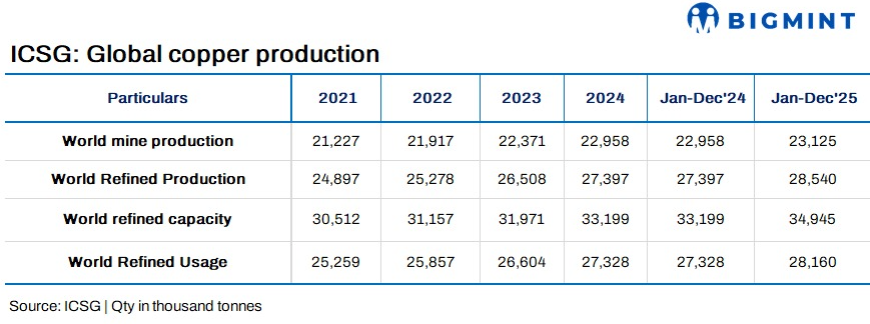
The International Copper Study Group (ICSG) reported preliminary data for CY’25, showing that global refined copper production grew by around 4.2% y-o-y, supported by a 3.9% rise in primary production (from ores via electrolytic and electrowinning processes) and a 5.8% increase in secondary production (from scrap).
Regional trends in refined copper production
The growth in global refined copper production during the CY’25 was primarily driven by China and the Democratic Republic of Congo (DRC), which together account for around 57% of global output and recorded a combined increase of about 9% (China +9.4%, DRC +7.8%). Excluding these two countries, world refined copper production declined by approximately 1.8%.
In Asia (excluding China), refined copper output is estimated to have decreased by 3.7%, mainly due to lower production in Japan and the Philippines. Japan’s output fell by 8.2% as a result of maintenance shutdowns, while the Philippines experienced a sharp 75% decline following the closure of the Pasar refinery. In Indonesia, the Amman and Manyar smelters/refineries commenced operations in March and July, respectively; however, overall output was affected by operational challenges at Amman and the Grasberg mine incident.
India recorded a 19% increase in refined copper production, supported by improved operating capacity rates and the ramp-up of the Adani refinery.
Chilean refined copper production declined by 10%, with electrolytic output (from concentrates) down 16% due to smelter maintenance shutdowns, and electrowinning (SX-EW) production decreasing by 6.8%.
Global secondary refined copper production (from scrap) increased by 5.8%, largely driven by growth in China.
Copper mine output up
Preliminary data indicates that global copper mine production increased by around 1% in CY’25, with concentrate output remaining broadly unchanged and solvent extraction-electrowinning (SX-EW) production rising by about 3%. The modest growth was supported by ramp-ups at projects reaching capacity and improved performance at several operating mines. However, lower ore grades and operational incidents at major sites — including Kamoa in May and Grasberg in September — constrained overall expansion.
Chile’s copper mine production declined by 1.6%, as higher output from Escondida, Centinela, Mantos Copper and Codelco operations was more than offset by reductions at Collahuasi, Los Pelambres and Quebrada Blanca.
In Peru, mine production increased by 1.2%, primarily driven by gains at Las Bambas, Toromocho, Quellaveco and Marcobre, which outweighed declines at Southern Copper, Cerro Verde, Antamina and Antapaccay.
The Democratic Republic of Congo (DRC) recorded an estimated 6% increase in mine output, supported by higher production at Tenke/Kisanfu, Mutanda and several other mines. However, Kamoa’s output declined by 11% in 2025 following a seismic incident in May.
Mongolia’s copper concentrate production surged by 37%, reflecting the ramp-up of the Oyu Tolgoi underground project.
Meanwhile, Indonesian mine production fell by around 43%, mainly due to lower output at Batu Hijau as a result of mine sequencing and significantly reduced production at Grasberg, impacted by a planned major maintenance programme earlier in the year and the suspension of mining activities following a severe mud rush incident in September.
Refined copper usage grows
Preliminary data suggests that global apparent refined copper usage increased by around 3% in 2025.
China’s apparent refined copper demand (excluding changes in bonded and unreported stocks) is estimated to have grown by approximately 4%. Despite this increase in demand, China’s net refined copper imports declined by 15%, reflecting a 5% drop in refined copper imports and a 74% surge in exports. China currently accounts for about 58% of total global refined copper usage.
Refined copper consumption outside China rose by around 2%, supported by stronger demand across several Asian and MENA countries, helping to offset weaker demand conditions in the EU and Japan.
Market surplus rises
Preliminary world refined copper balance shows an apparent surplus of about 380,000 t in CY’25. Adjusting for estimated changes in Chinese bonded inventories, the refined copper balance suggests a market surplus of around 437,000 t.
Copper prices
China’s bonded copper stocks are estimated to have increased by around 57,000 t in 2025 compared with end-2024 levels.
Combined copper stocks at the major metal exchanges (LME, COMEX and SHFE) totalled 933,641 t at end-January 2026, marking the highest level since September 2003. This represents an increase of 189,526 t (+25%) compared with end-December 2025 levels, with stocks rising at the LME (+29,350 t), SHFE (+87,662 t) and COMEX (+72,514 t).
The average LME cash price for January was US$ 13,088.88/t, up 11% from the December average of US$ 11,803.79/t.
The 2026 high was US$ 13,844/t on 29 January, and the low was US$ 12,561/t on 17 February.
The year-to-date average stands at US$ 13,010.45/t, approximately 31% above the 2025 annual average.
Leave a Reply