- Global refined copper market records 131,000 t surplus in H1CY26
- Exchange inventories rise nearly 30% to highest level since 2003
Global copper inventories have climbed to their highest level in more than two decades as refined copper production continues to outpace consumption despite persistent mine supply disruptions across several key producing regions, according to the International Copper Study Group (ICSG).
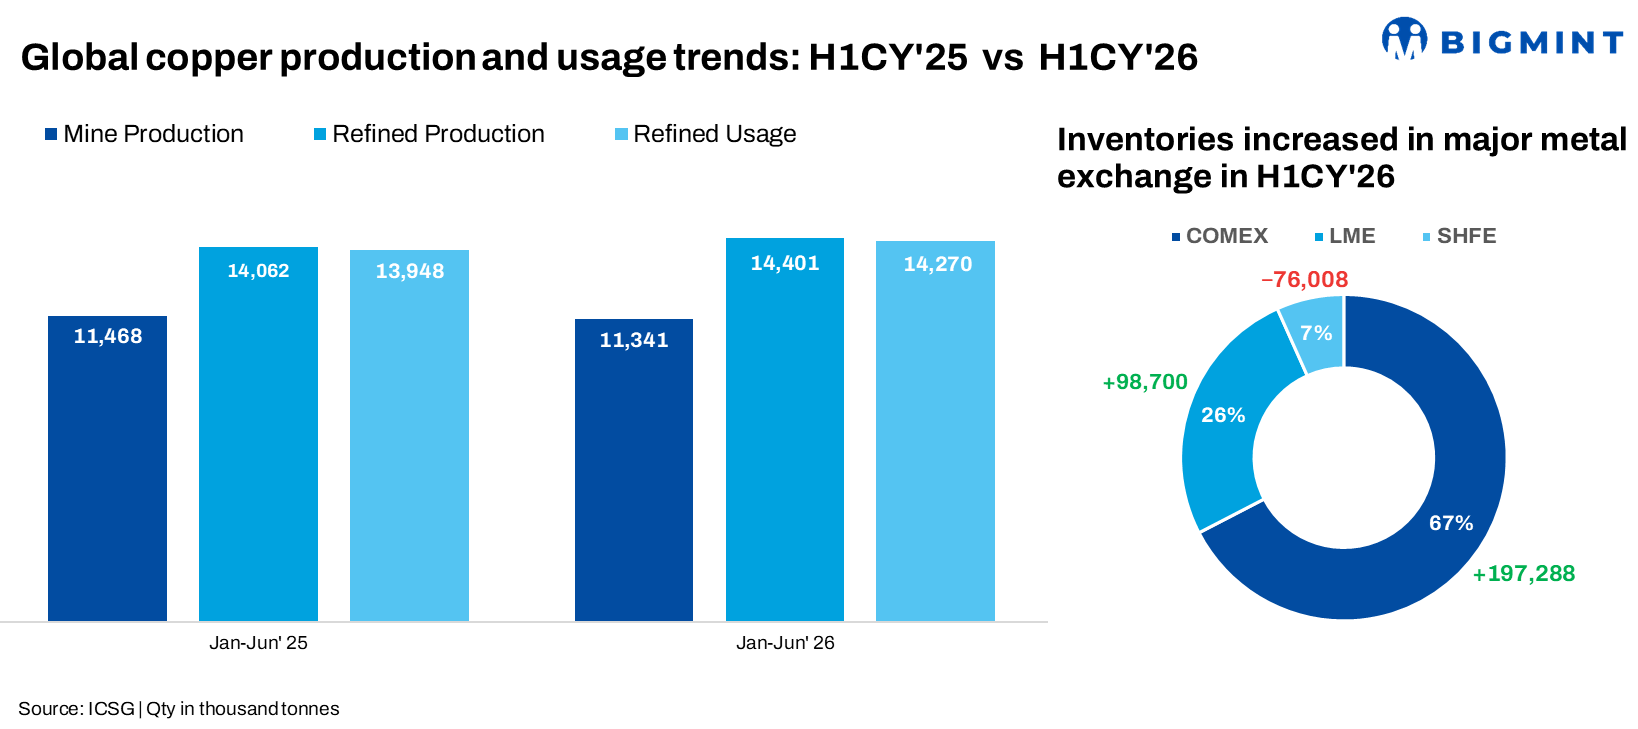
The global refined copper market recorded a preliminary surplus of 131,000 t during January-June 2026, compared with a surplus of 114,000 t in the corresponding period last year. After adjusting for estimated changes in Chinese bonded stocks, the surplus stood at around 98,000 t, highlighting improved metal availability despite ongoing challenges in the upstream mining sector.
Global mine production declined 1.1% year-on-year (y-o-y) to 11.34 million tonnes (mnt) during the first half of 2026. The decline was largely driven by a 2.6% fall in concentrate output, reflecting operational disruptions at several major mining operations.
Indonesia remained the largest source of supply pressure, with concentrate production falling 32% following the impact of the September 2025 mud rush incident at Grasberg. Chile’s mine production dropped 6.6% amid weaker output from El Teniente, Escondida and Spence, while the Democratic Republic of Congo (DRC) continued to feel the effects of operational disruptions at Kamoa. In contrast, Peru and Mongolia posted production gains, supported by stronger output from major mining projects.
Despite weaker mine supply, global refined copper production rose 2.4% y-o-y to 14.40 mnt. Growth was driven by higher output from China and the DRC, which together account for nearly 59% of global refined copper production. China’s refined output increased 5.3%, while DRC production rose 7.9%. India’s refined copper output also expanded by 20%, supported by improved operating rates and the continued ramp-up of new refining capacity.
Global apparent refined copper usage increased 2.3% y-o-y, with Chinese demand rising 3.2% and consumption outside China growing by 1%. However, refined production continued to outpace demand growth, resulting in a wider market surplus.
The surplus has been reflected in exchange inventories. Combined copper stocks across the LME, COMEX and SHFE reached 964,095 t at the end of July, the highest level since August 2003. Inventories increased by 219,980 t, or 29.6%, compared with end-2025 levels. The majority of the increase occurred in the United States, where COMEX inventories expanded sharply, while SHFE stocks declined.
However, the inventory build-up has not eliminated concerns over physical availability. A mid-August squeeze in the London market pushed the LME cash premium over the three-month contract to $545/t, highlighting the disconnect between headline stock levels and immediately available deliverable metal.
Copper prices have remained resilient despite the surplus. The average LME cash copper price eased marginally to $13,525/t in July, but prices subsequently climbed to a 2026 high of $14,850/t on 17 August. The year-to-date average remains around 33% above the 2025 annual average.
Outlook
The copper market is likely to remain well supplied in the near term as refined production growth continues to offset mine disruptions. However, tightening physical availability, uneven exchange inventories and resilient demand from electrification, renewable energy and AI-related infrastructure could provide support to prices.
Leave a Reply