- Nov’25 aluminium production drops 3.3% m-o-m
- LME prices rise 7% y-o-y in 11MCY’25, stocks down 37%
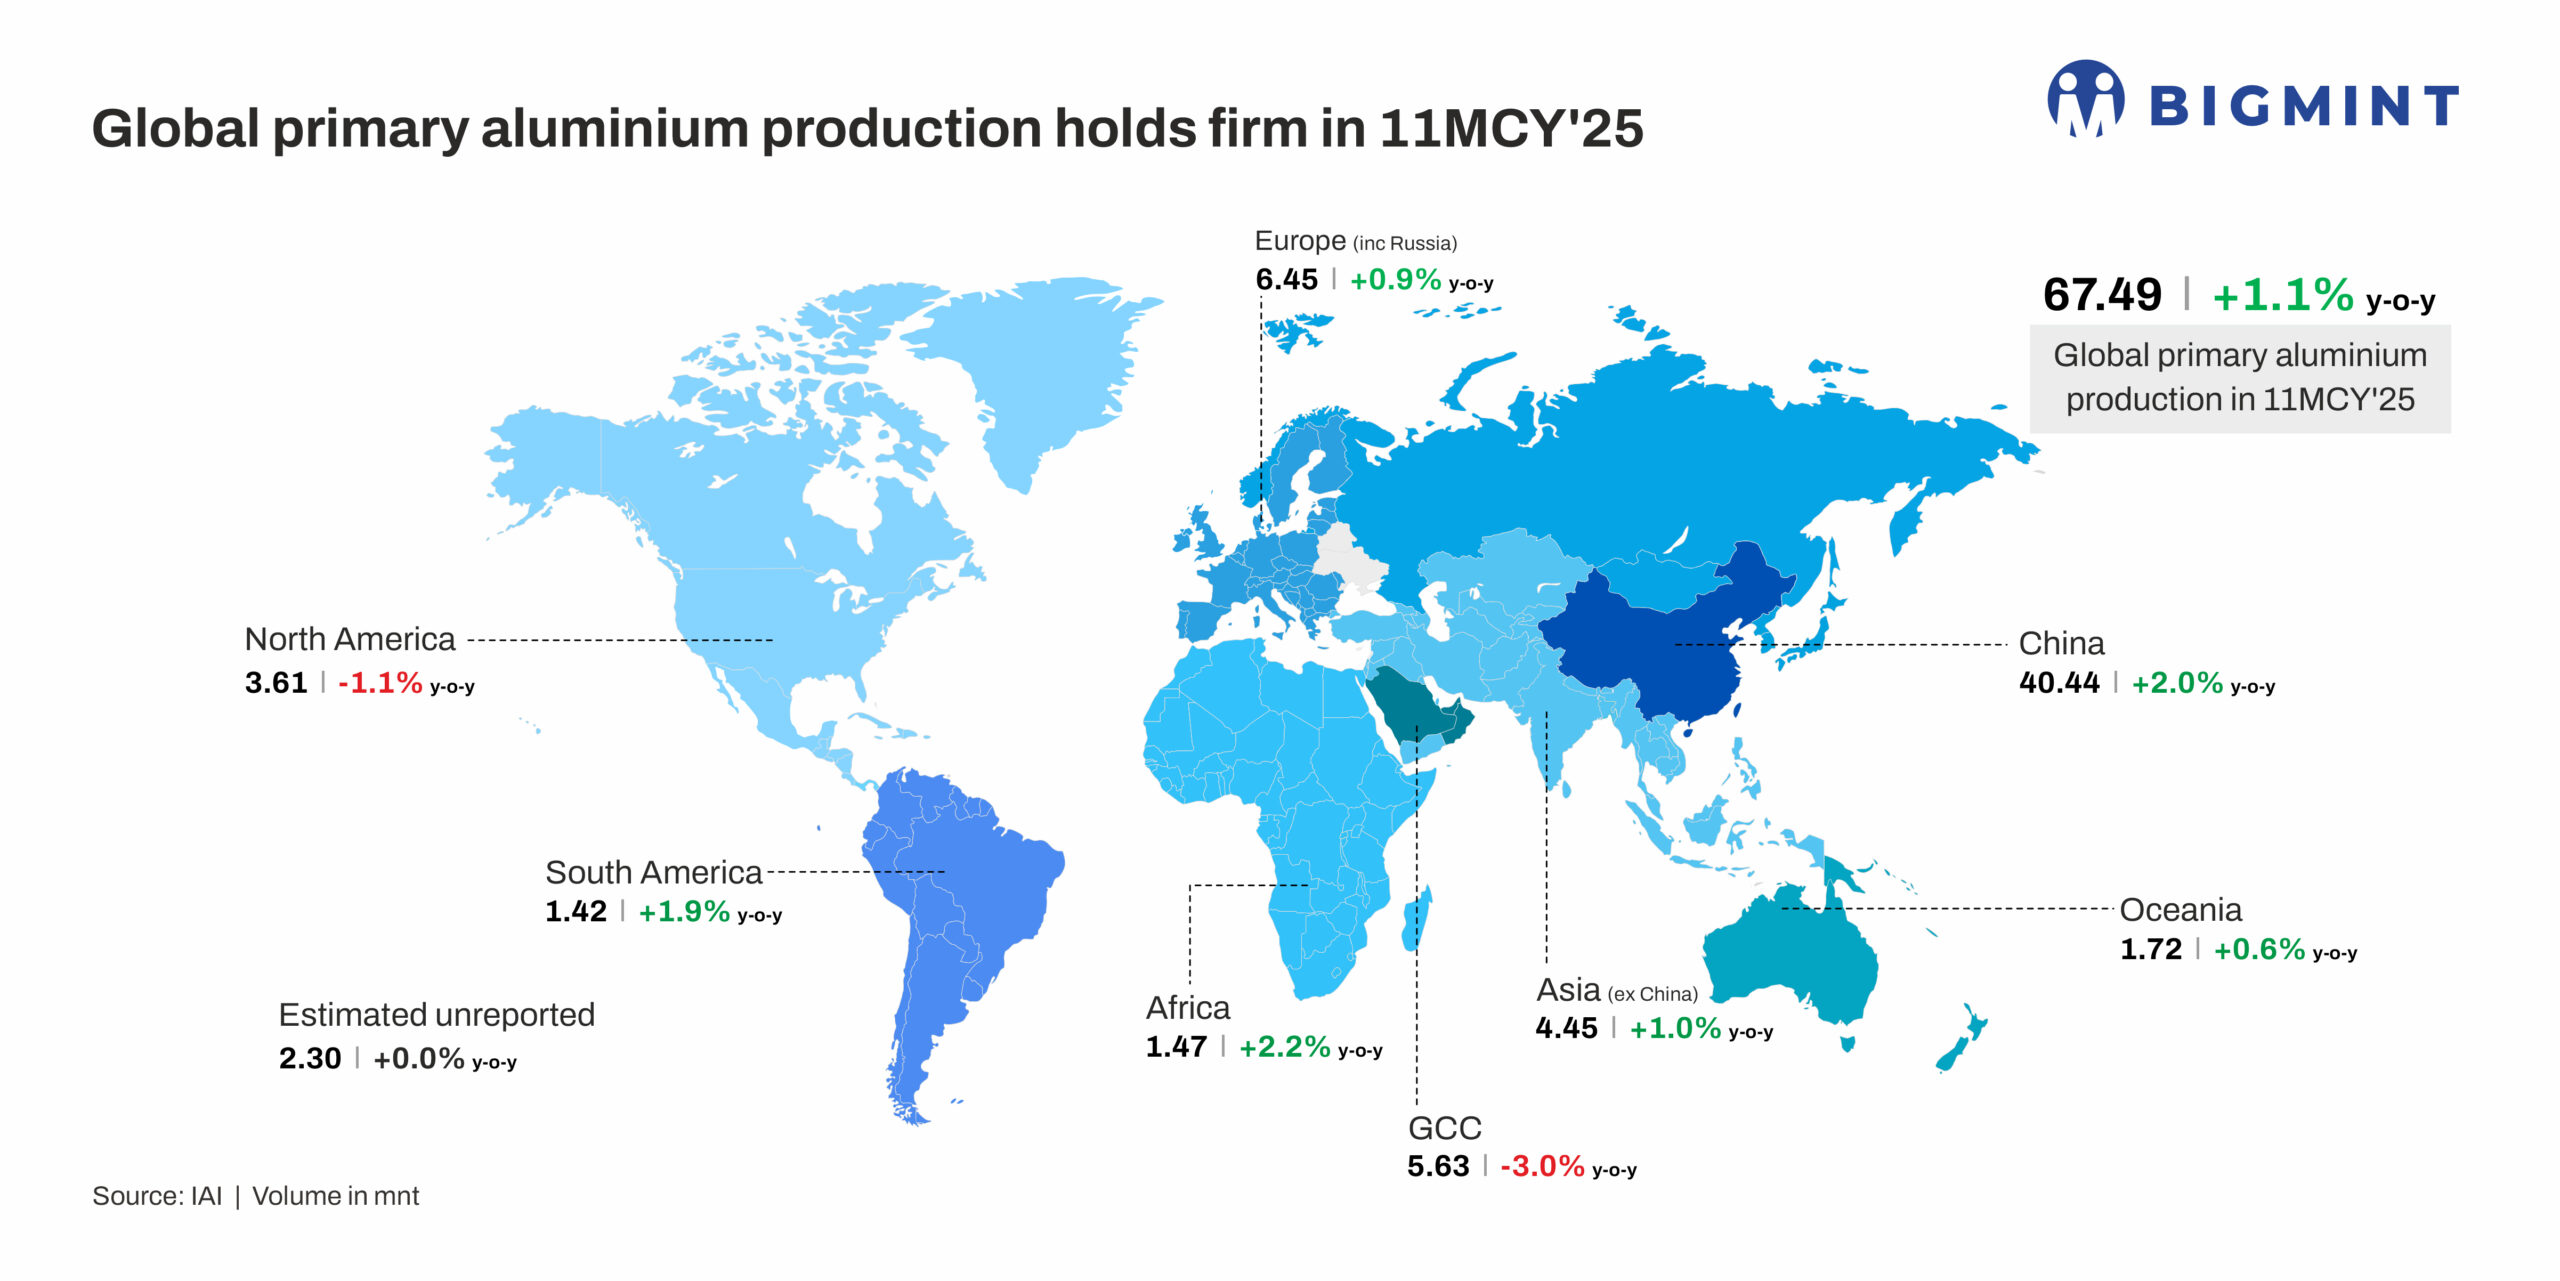
Global primary aluminium production reached 67.49 million tonnes (mnt) in 11MCY’25, registering a 1.1% y-o-y increase from 66.74 mnt in 11MCY’24. The modest growth underscores broadly stable output levels across key producing regions, with consistent smelter operations offsetting intermittent demand fluctuations and regional supply adjustments.
However, global primary aluminium production in November 2025 fell 3.3% m-o-m to 6.09 mnt from 6.29 mnt in October.
Country-wise breakdown
China, the largest producer, saw output rise 2% m-o-m to 40.44 mnt, maintaining its dominant position in global supply. Africa recorded a 2.2% m-o-m increase to 1.47 mnt, while South America’s production grew 1.9% m-o-m to 1.42 mnt.
North American output declined 1.1% m-o-m to 3.61 mnt, and Asia (excluding China) posted a 1.0% m-o-m rise to 4.45 mnt. Europe (including Russia) registered a 0.9% m-o-m increase to 6.45 mnt, while Oceania saw a modest growth of 0.6% m-o-m, reaching 1.72 mnt. The GCC region experienced a 3.0% m-o-m fall to 5.63 mnt, while estimated unreported production remained unchanged at 2.30 mnt.
Overall, global aluminium production in November showed mixed m-o-m trends, with strong gains in China, Africa, and South America offset by declines in North America and the GCC, highlighting regional disparities in smelter operations and market conditions.
Modest growth in primary production
Global primary aluminium production in 11MCY’25 rose only modestly by about 1.1% y-o-y to approximately 67.49 mnt. This restrained growth reflects a slower pace of expansion across major producing regions compared with previous years.
One of the central drivers of this modest growth is China’s position as the dominant producer — accounting for around 60% of global aluminium output — where annualised production is approaching the 45 mnt cap set by policy to curb overcapacity and environmental impact.
Because Chinese smelters operate close to this ceiling, there is limited headroom for large increases in supply, which in turn slows global production growth despite ongoing demand from transport, construction, and energy sectors.
Input material dynamics have also influenced production trends. Alumina — the key feedstock for aluminium smelting — saw a decline in operating rates and output in November in some regions due to environmental curbs, maintenance, and adjustments, which reduced metallurgical‑grade alumina output by about 4.4% m-o-m in China.
Seasonal maintenance work and equipment adjustments further contributed to temporary supply tightness for smelters, putting pressure on production throughput even as overall alumina capacity remained large. This situation has a direct bearing on aluminium output because smelters depend on a steady flow of alumina to sustain production levels.
Moreover, seasonal and market‑cycle factors played a significant role in November’s m-o-m contraction of global primary aluminium production. According to industry statistics, domestic aluminium production in November saw a downward trend in operating rates as the sector transitioned from the peak consumption season to off‑season conditions, and the proportion of liquid aluminium produced decreased, reflecting weaker downstream processing activity. Such seasonal shifts typically occur toward year‑end as downstream demand softens and smelters schedule maintenance or upgrades.
Finally, broader macro and cost pressures — including high energy costs in some regions, evolving trade policies, and cautious production planning due to uncertain demand — have also restrained output growth. These factors contribute to a production environment where annual volumes remain stable but are resistant to sharp increases, while month‑to‑month fluctuations like the November dip are explained by short‑term operational adjustments, seasonal demand cycles, and input supply dynamics.
Impact of pricing
LME aluminium prices increased by 7% y-o-y to $2,610/t in 11MCY’25, up from $2,445/t a year earlier. Meanwhile, inventories at LME-registered warehouses declined sharply, falling 37% y-o-y to 479,796 t from 767,577 t in the previous year.
Aluminium prices have risen sharply y-o-y, driven by a combination of policy, macro, and supply-side factors. US tariffs have tightened global trade flows, while anticipated US Fed rate cuts have improved investor sentiment toward commodities. On the supply side, a structural deficit is expected in 2026-27 as several global smelters struggle to secure long-term power contracts, including facilities in Mozambique and Iceland. Meanwhile, China has largely reached its 45 mnt capacity cap, limiting incremental supply. Against this backdrop, market participants increasingly expect LME aluminium prices to test the $3,000/t level.
Outlook
Global aluminium production is expected to reach around 73.5 mnt in 2025, despite supply disruptions, seasonal maintenance, and regional constraints. China’s 45 mnt cap limits incremental output, while strong production from Africa and South America partially offsets slower growth in North America and the GCC. High energy costs and cautious smelter operations are likely to keep full-year growth modest.
Leave a Reply