- Refined copper output outpaces mine supply
- India refined output jumps 25%
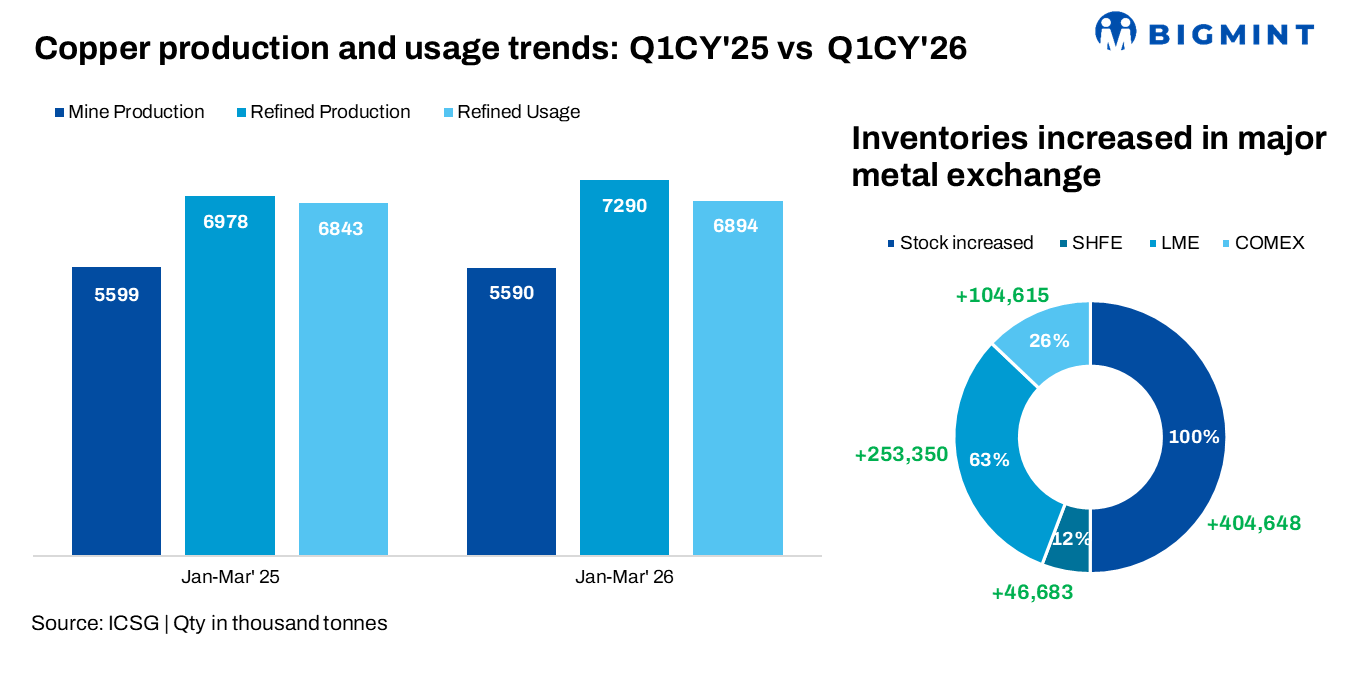
Global copper mine production remained largely unchanged in Q1 2026 compared to the same period last year, as a 1.1% decline in concentrate production was offset by a 3.3% increase in solvent extraction-electrowinning (SX-EW) output, according to the International Copper Study Group (ICSG).
Chile’s mine output declined by 5.8%, while Indonesia’s concentrate production plunged 42% due to ongoing constraints at the Grasberg mine; in contrast, Peru and Mongolia recorded gains of 3.3% and 36%, respectively, driven by stronger output from key mines and the Oyu Tolgoi underground ramp-up
Global refined copper production rose 4.5% on Q1 2026
Primary refined output rose 3.8%, while secondary (scrap-based) production increased by 7.6%, largely driven by China. China and the DRC, which account for nearly 60% of global refined copper output, recorded a combined 9% increase, led by China (+8.8%), while production elsewhere declined 1.4%, with Chile down 11.7% due to smelter constraints and Asia ex-China falling 4%; India stood out with a sharp 25% rise driven by improved operating rates and the Adani refinery ramp-up.
Demand remains subdued despite modest ex-China growth
Demand outside China rose by 1.7%, while Chinese apparent demand remained broadly flat, impacted by a 40% decline in net refined copper imports. As China accounts for approximately 58% of global copper usage, weaker import activity significantly limited overall consumption growth.
As a result, the global refined copper market recorded a surplus of 396,000 t in Q1 2026, nearly three times higher than the 135,000t surplus recorded in the same period last year.
Stocks surge to multi-decade highs
Copper inventories across the LME, SHFE and COMEX climbed to 1.15 mnt by end-April 2026, the highest level since January 2003, reflecting continued surplus material accumulation.
Stocks rose by 404,648 t (+55%) from end-December 2025, with gains across all three exchanges, while China’s bonded stocks are estimated to have declined by around 10,000 t during Q1.
The average LME cash copper price rose 3% m-o-m to $12,891/t in April from $12,499/t in March. During the year, prices ranged between a low of $11,826/t and a peak of $14,097/t in mid-May, while the year-to-date average stood at $12,947/t, around 30% above the 2025 annual average.
Market outlook
The global copper surplus widened further in Q1 2026, supported by stronger refined production growth, particularly from primary and secondary output, while demand growth remained muted due to weaker Chinese import activity. Despite stable mine supply and modest consumption growth outside China, excess material continued to flow into exchange warehouses, pushing inventories to multi-decade highs and reinforcing signs of oversupply.
In the near term, benchmark copper prices are likely to remain in the $13,000-$14,000/t range, with support from long-term energy transition demand expectations offset by pressure from elevated inventories and weak physical market fundamentals, until stronger end-use consumption emerges to absorb the surplus.

Leave a Reply