- US copper imports decline as tariffs weigh on finished product inflows
- India captures larger share of US copper scrap exports
The US copper trade balance in the first half of 2026 shows a market adjusting to tariff uncertainty rather than simply responding to stronger or weaker consumption. The trade flows are being reshaped by the economics of bringing copper units into the US, processing them domestically and positioning inventories ahead of further changes to Section 232 policy.
According to BigMint data, US copper imports declined 7.6% y-o-y to 1.13 mnt during January-June 2026, with the decline mainly concentrated in finished copper products. Finished long imports plunged 75%, while finished flat imports fell 24%. At the same time, semi-finished copper imports increased 4% to around 0.9 mnt, while copper scrap imports climbed 39% to 85,433 t.
Scrap exports rise as India gains importance
Copper scrap tells a different story from refined copper.
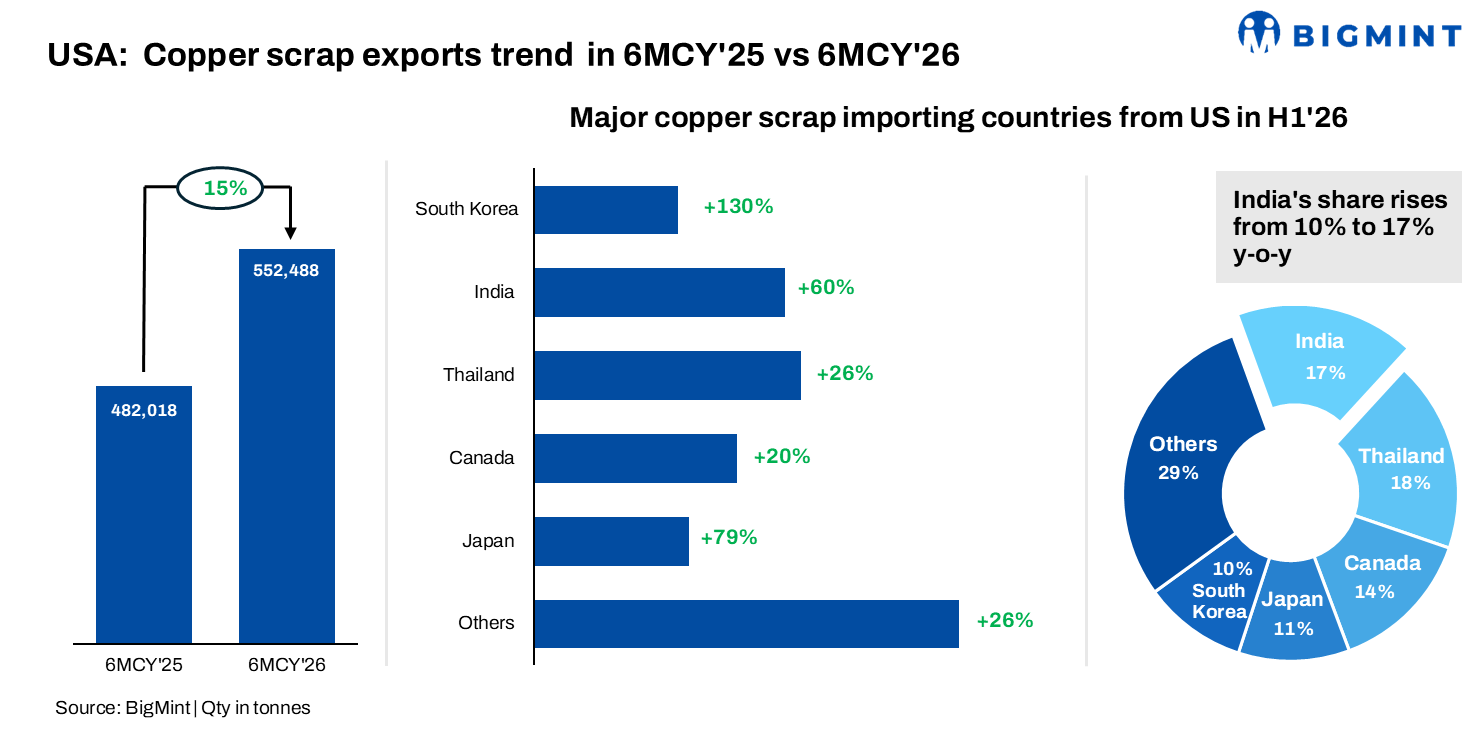
US copper scrap exports increased by around 15% y-o-y to 0.55 mnt during H1’26 in the corresponding period of 2025. The increase was broad-based across several major destinations, but India recorded one of the strongest gains.
US copper scrap shipments to India increased 60% y-o-y during H1’26. India’s share of total US copper scrap exports rose to 17% from 10% a year earlier. The increase came as China’s direct participation weakened amid ongoing US-China trade tensions and existing trade barriers, allowing Indian and other Asian buyers to capture a larger share of available US-origin scrap.
Thailand remained an important buyer, with shipments increasing 26% y-o-y, while Japan recorded a 79% increase, while South Korea recorded the strongest growth among the major destinations at 130%.
The H1’26 data therefore point to a redistribution of US copper scrap trade rather than a decline in overseas demand, with India emerging as one of the biggest beneficiaries of the changing destination mix.
Tariff uncertainty supports refined copper inflows
The US had imposed a 50% Section 232 tariff on semi-finished copper products in August 2025, while the administration had directed the Commerce Secretary to provide an update on domestic copper markets by June 30, 2026. That update was intended to help determine whether phased tariffs on refined copper should be introduced from 2027.
The uncertainty remained a major market factor during H1’26. By May, market participants were moving material into US warehouses ahead of the expected late-June review, with more than 0.57 mnt held in warehouses approved for delivery against US futures contracts at the time.
US copper cathode imports increased 3.5% y-o-y to 0.85 mnt during January-June. Monthly arrivals also increased with 19% rise m-o-m from in May.
The origin profile also highlights the US dependence on overseas refined copper. Chile accounted for 48% of US cathode imports during H1, followed by Canada (11%), Congo (12%), Peru (7%), Mexico (4%) and Zambia (4%).

Downstream copper imports decline sharply
The most striking contrast in the H1 trade data was the collapse in imports of finished copper products.
Finished long imports declined 75% y-o-y to 39,594 t. Within the category, wire imports fell 84% to 17,974 t, while bars, rods and profiles declined 51% to 21,620 t.
The decline was not limited to long products. Finished flat imports fell 24% to 109,038 t. Pipes and tubes declined 28%, rolled plates fell 21%, and foils decreased 10%.
The June 1 tariff proclamation explicitly stated that the policy was intended to encourage increased use of US-produced metals in downstream derivative products. It also reduced the threshold for products to qualify as made entirely from US copper, aluminium or steel from 95% to 85%.
Therefore, the H1 trade data suggest that the tariff regime was affecting the composition of copper trade, not simply its overall volume.

Markets have already moved ahead of the tariff
LME copper prices reach above $14,000/t as LME inventories declined 24% over the past month to 223,000 t. The broader inventory picture is increasingly lopsided.
Over the past three months, CME stocks increased by 81,709 t, or 15%, while LME inventories declined by 93,950 t, or 24% and SHFE stocks fell by 166,213 t, or 62%. CME inventories have climbed to 613,741 t, making them around 1.5 times the combined inventories of LME and SHFE.
The divergence reflects both US arbitrage and Chinese consumption. CME copper has traded at a premium of around $300-600/t over LME copper in recent months, encouraging traders to move metal into US warehouses ahead of potential tariffs.
The resulting tightening outside the US is also reflected in the Yangshan copper premium, which rose to $80-90/t, its highest level since June 2025. The inventory divergence suggests that tariff expectations are already reshaping the geographical distribution of copper rather than simply increasing global demand. More metal is being positioned in US warehouses, while LME and SHFE stocks decline.
Outlook
In the second half of 2026, US copper trade flows are likely to remain closely tied to the outcome of the tariff review. If higher duties are imposed on refined copper, US buyers may continue to favor refined units over finished copper products, reinforcing the sharp divergence seen in H1’26. Higher domestic copper values could also improve the economics of holding scrap within the US, encouraging refiners, wire-rod manufacturers and secondary processors to compete more actively for feedstock.
However, China’s continued trade barriers could keep India and other Asian markets important outlets for US-origin scrap if domestic US demand remains insufficient to absorb available material.
Longer term
Global copper demand is expected to remain supported by structural growth in electrification, renewable energy, electric vehicles, power transmission and AI-related infrastructure. Data centres alone consumed more than 200,000 t of copper in 2025, compared with less than 30,000 t four years earlier, highlighting the rapidly increasing copper intensity of digital infrastructure.
This suggests that US tariffs are more likely to redistribute global copper flows than reduce underlying demand. If the US retains more refined copper and scrap domestically, competing consuming regions may need to source additional material from other origins. Conversely, if US domestic processing capacity expands, the country could gradually reduce its dependence on imported refined copper while retaining a larger share of its scrap.

Leave a Reply