- India’s copper demand grows at strongest pace in 5 years
- LME prices rise 15% y-o-y on tight supply, firm demand
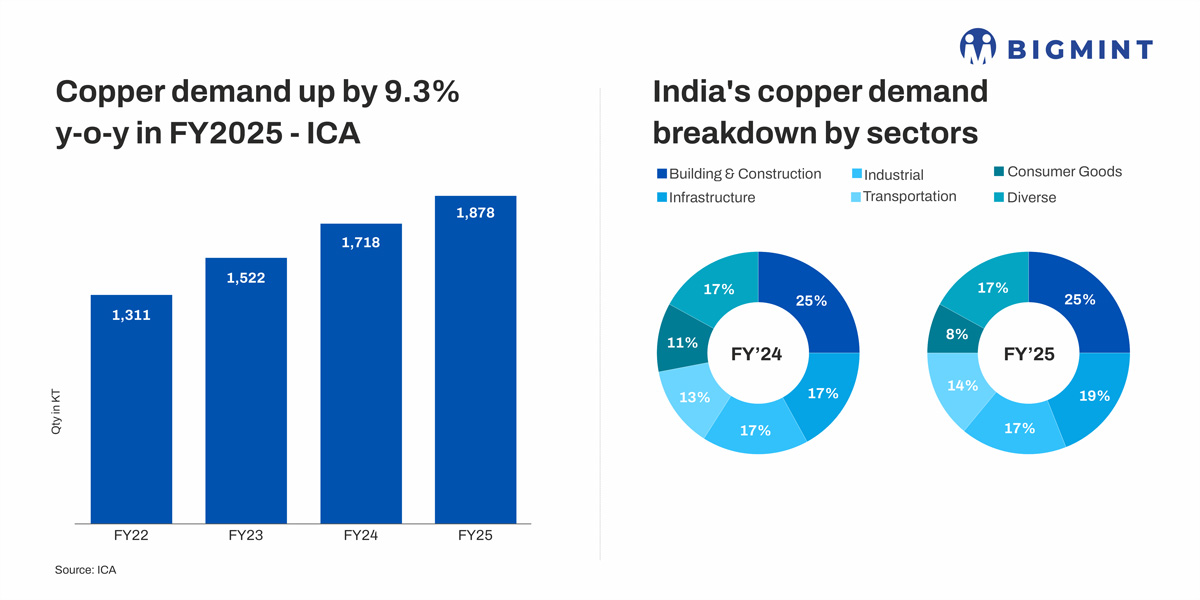
India’s copper demand rose sharply by 9.3% y-o-y to 1.878 million tonnes (mnt) in FY’25 from 1.718 mnt in FY’24, according to International Copper Association (ICA) India. This strong growth — the highest in five years — underlines the nation’s structural shift towards electrification, industrialisation, and clean energy expansion.
Now, as FY’26 unfolds, the question is whether this momentum can be sustained amid global supply headwinds, volatile London Metal Exchange (LME) prices, and India’s rising import reliance.
Notably, average LME copper prices rose sharply by nearly 15% y-o-y, from around $8,700/t in FY’24 to approximately $10,000/t in FY’25.
Why was FY’25 the strongest year in half a decade?

Copper demand growth in FY’25 outpaced the five-year average of 6-7%, marking the fastest expansion since FY’19. The surge was driven by a broad recovery across all key segments — infrastructure (+17%), building construction (+11%), clean energy and mobility (+28%), and consumer durables (+19%). Unlike prior years when growth stemmed mainly from restocking or short-term projects, FY’25 saw structural demand acceleration linked to policy-led investments, including the National Infrastructure Pipeline, Gati Shakti, and rapid renewable capacity additions (+38%).
What’s fuelling India’s copper consumption boom?
Infrastructure remained the primary growth driver, accounting for a 17% rise in copper usage in FY’25. Major infrastructure programmes such as the National Infrastructure Pipeline (NIP) and Gati Shakti continued to expand copper demand across railways, metro corridors, and power grids. Solar capacity additions surged 38%, while power transformation capacity rose 22%, reflecting grid modernisation and renewable integration.
Given that each megawatt (MW) of solar and wind capacity requires roughly 3-4 tonnes (t) and 2.5-3 t of copper, respectively, this rapid expansion has structurally elevated India’s copper intensity per unit of GDP.

How is India’s construction boom reshaping copper intensity?
The building and construction sector registered 11% growth, driven by premium residential and commercial projects and a rise in smart infrastructure. Developers are increasingly using thicker, higher-conductivity copper wiring — from 1.5 sq mm to 1.75 sq mm — in compliance with upgraded safety standards. Construction GVA grew 9.4% in FY’25, and this year’s demand pipeline remains strong, particularly from data centres, logistics parks, and green buildings.
Meanwhile, copper use in clean energy and mobility rose 28% y-o-y to 87,000 t last fiscal, supported by a record year for solar and wind additions. EV sales climbed 16% y-o-y, led by electric two- and three-wheelers — now dominating 95% of India’s EV market. With FY’26 EV registrations already up 12% in Q2, copper demand from motors, batteries, and charging networks is expected to remain firm through the remainder of the fiscal year.
Each EV consumes 60-80 kg of copper, while fast-charging stations use up to 8 kg per unit, underscoring copper’s integral role in India’s decarbonization roadmap.
What’s happening on supply, pricing side?
On the global front, mine disruptions and production downgrades have tightened the refined copper balance. Glencore’s output fell 17% y-o-y in January-September 2025 to 583,500 t, and its full-year guidance has been revised down to 850-875,000 t. Similarly, Freeport-McMoRan’s Grasberg mine continues under force majeure, while Anglo American and Antofagasta trimmed production forecasts due to lower ore grades in Chile.
These developments have kept LME copper prices elevated at $10,890-11,200/t (as of 31 October) — about 30% higher y-o-y. However, prices eased slightly this week as traders booked profits and Chinese smelters resumed partial output post-maintenance.

Can India’s supply chain handle rising demand?
India’s copper ecosystem is adapting to balance rapid demand growth with limited domestic production. Secondary copper now contributes 42% of the total supply, up from 38% in FY’24, driven by improved recycling infrastructure and import substitution policies. Copper scrap imports surged 33% y-o-y to 132,000 t in Q2FY’26, reflecting steady feedstock inflows despite high global premiums.
Yet, India’s refined copper production capacity — led by Hindalco, Vedanta, and Hindustan Copper – remains below its consumption needs, forcing reliance on imports. The government’s focus on recycling, refining expansion, and BIS-certified scrap processing will be critical to bridging this gap in FY’26-27.
Outlook – What’s next for India’s copper growth story?
ICA India’s Managing Director, Mayur Karmarkar, emphasised that India must now focus on “building functional copper reserves and resilient supply chains” to sustain its long-term growth ambitions. The next phase of demand growth will hinge on domestic capacity expansion, policy alignment, and clean-tech manufacturing — ensuring copper remains central to India’s Viksit Bharat @2047 vision.
In essence, FY’25 marked the inflection point where copper became a proxy for India’s development trajectory. FY’26 will decide whether that momentum can evolve into sustainable, supply-backed growth.
Leave a Reply