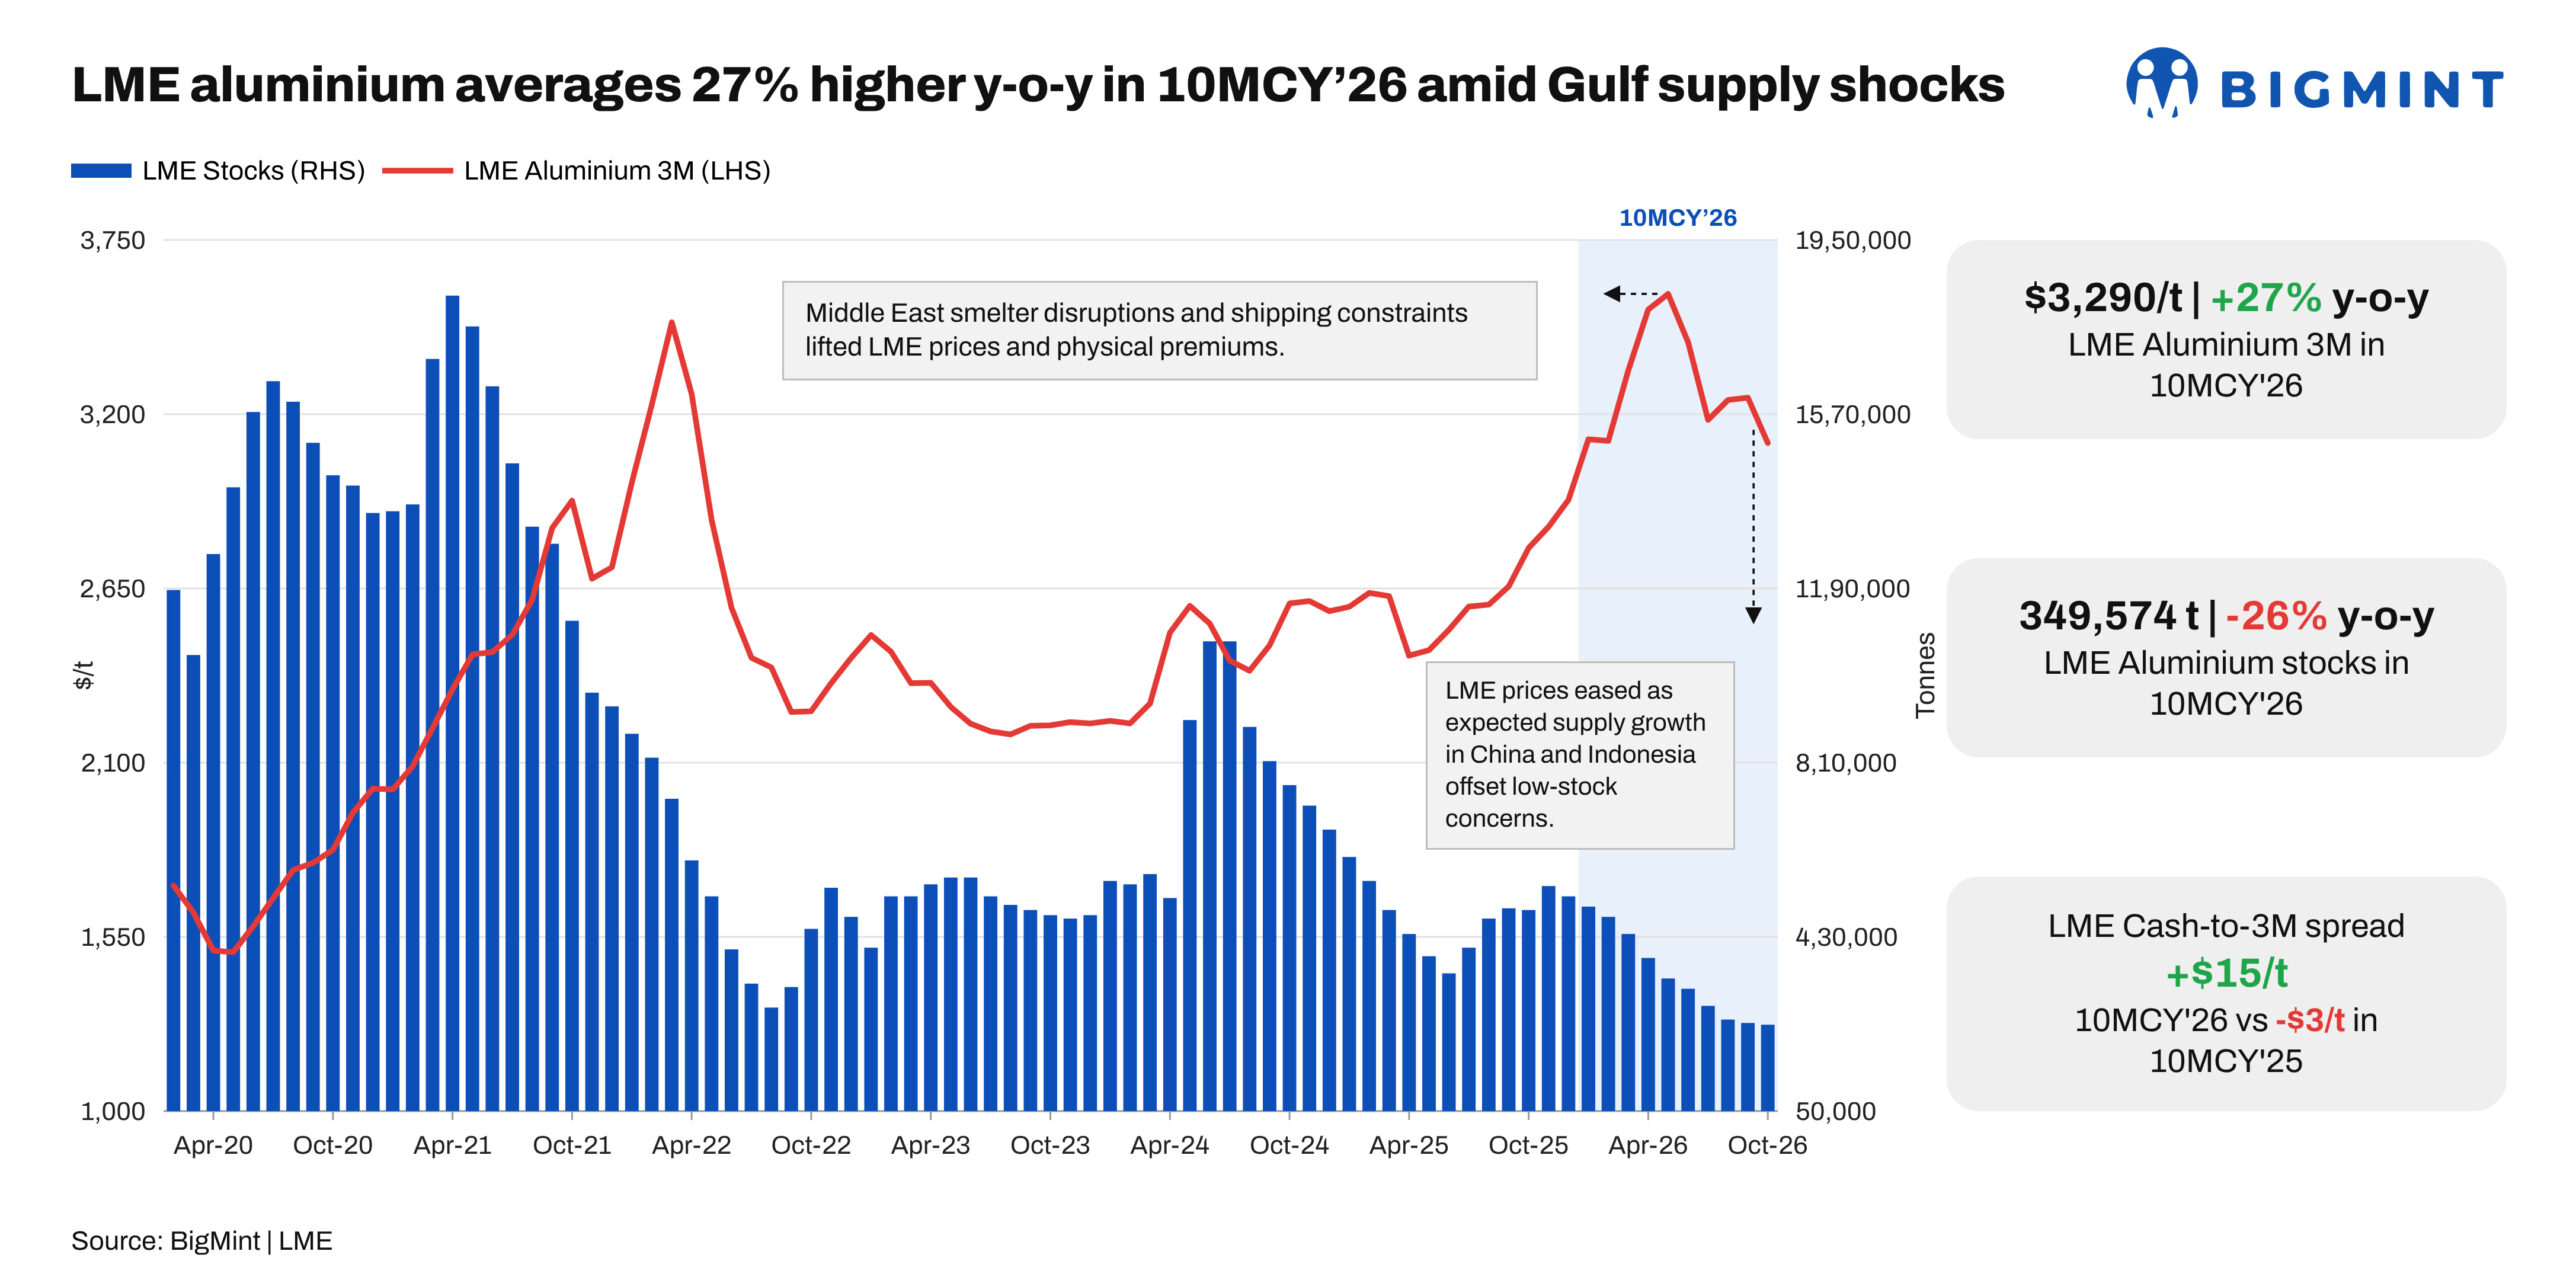
- Average LME stocks fall 26% y-o-y
- Cash-to-three-month spread shifts into backwardation in 10MCY’26
LME aluminium’s three-month benchmark price averaged $3,291/t in the first ten months of 2026, up 27% from $2,589/t in January-October 2025. The benchmark reached a four-year high in May-June as conflict in the Middle East disrupted supply and raised concerns over metal availability, before retreating as expectations of additional supplies grew.
The correction came even as average LME stocks fell 26% to 349,574 t from 473,049 t a year earlier. The cash-to-three-month spread also shifted from a $3/t contango in 10MCY’25 to a $15/t backwardation in 10MCY’26. Aluminium therefore remained tighter than a year earlier, while the premium for immediate metal had narrowed from its mid-year peak.
Gulf disruption drove the May-June rally
The conflict in the Middle East disrupted aluminium supply from the Gulf, an important production and export region. Disruptions to smelters and shipping routes raised concerns over the volume of metal available to international buyers.
The supply problem extended beyond production losses. Uncertainty around shipments, access to raw materials and the time needed to arrange replacement cargoes made physical metal harder to secure. For buyers dependent on Gulf-origin aluminium, securing material on schedule became a greater concern alongside the LME benchmark price.
The combination pushed the three-month LME price higher in May-June. When future availability becomes uncertain, buyers place greater value on securing metal earlier, supporting both the exchange price and physical premiums.
Physical premiums diverged across regions
The LME three-month price does not represent the full procurement cost for physical aluminium. Regional premiums also reflect local availability, freight, tariffs and competition for deliverable metal.

The US and Europe experienced significant pressure on physical premiums during 2026. In Europe, the duty-paid premium reached $559/t in October, around double its level at the end of February. Japan’s fourth-quarter premium, by contrast, settled at $255/t, down 35% q-o-q but up 197% y-o-y from $86/t in Q4 2025. Japan’s premium, commonly referred to as the MJP (Main Japanese Ports) premium, is the regional premium paid above the LME aluminium price for physical metal delivered to major Japanese ports, and reflects the local cost and availability of aluminium. The contrasting movements show that physical tightness and premium trends varied across regions, reflecting differences in local availability and supply conditions.
The divergence indicates that the impact of supply disruptions varied by region. A lower LME benchmark price does not necessarily reduce procurement costs where regional premiums remain elevated. Similarly, a falling premium in one market can reflect access to alternative supplies without indicating a broad improvement in global aluminium availability.
LME stocks fell 26%, leaving a smaller visible buffer
Average LME inventories declined to 349,574 t in 10MCY’26 from 473,049 t in 10MCY’25. The 26% decline reduced the amount of visible exchange metal available to absorb an unexpected supply disruption or a sudden increase in demand.
The lower stocks did not mean every consuming region faced the same physical shortage. Metal can move between exchange warehouses and physical consumers as regional prices, premiums and delivery requirements change. LME inventories therefore need to be assessed alongside trade flows and metal held outside the exchange system.
The lower exchange stock level nevertheless leaves less visible inventory available if Gulf shipments remain constrained or another producer faces an outage. Rebuilding stocks after a disruption can also take time, leaving the market exposed to renewed price volatility.
The forward curve shows tighter nearby availability
The LME cash-to-three-month spread also changed materially from 2025 to 2026. In 10MCY’25, the average LME cash price was $2,586/t, compared with $2,589/t for three-month aluminium, leaving cash at a $3/t discount. In 10MCY’26, the average LME cash price rose to $3,306/t, while the three-month benchmark averaged $3,291/t, putting cash at a $15/t premium.
The move from a $3/t contango to a $15/t backwardation indicates tighter nearby availability than a year earlier. Buyers were paying more for aluminium available immediately than for metal deliverable three months later.
The spread was considerably tighter by October than during the mid-year squeeze. The cash premium over three-month aluminium exceeded $100/t in June before easing substantially. By October, the premium had narrowed to $15/t, indicating that the immediate shortage pressure had eased even though stocks remained low.
Replacement supply pulled prices lower
The decline in aluminium prices after May-June followed a change in expectations for future supply. Additional supplies from China and Indonesia gave buyers alternatives to metal affected by Gulf disruptions. Indonesia exported a record 114,000 t of primary aluminium in July, while Chinese exports of aluminium alloy and semi-finished products also supplied overseas markets.
These flows did not replace all of the metal affected by Gulf disruptions. They increased the number of supply options available to buyers and reduced the likelihood that the entire shortfall would have to be covered by a limited group of suppliers.
That change in expected availability can push prices lower before exchange inventories recover. LME stocks measure metal held in exchange warehouses at a point in time, while the three-month benchmark price reflects expectations about supply and demand over the forward period.
The two indicators can therefore move in different directions. A market can have declining exchange stocks while prices fall if traders expect replacement metal to become more readily available in the coming months.
Aluminium remains exposed to another supply shock
The first ten months of 2026 produced a higher average LME price, lower exchange inventories and a shift from contango to backwardation. The $3,291/t average three-month benchmark price remains well above the $2,589/t average recorded in January-October 2025. At the same time, the 349,574 t average LME inventory level is 26% below last year, while the cash price averaged $3,306/t against $3,291/t for three-month aluminium in 10MCY’26.
The retreat from the May-June high has therefore reduced the immediate shortage premium without restoring the inventory buffer seen a year earlier. Further price relief will depend on alternative supplies reaching consuming markets, disrupted production and shipping recovering, and demand absorbing available metal at current prices.
If Gulf supply remains constrained or another disruption removes additional metal, the lower LME stock base leaves less visible inventory to absorb the shock. The 2026 correction has shifted the market’s focus from the loss of Gulf supply to the reliability and volume of replacement supply
Leave a Reply