- Japan’s Sept import decline outweighs higher shipments to China
- Newcastle leads annual gains despite a weaker third quarter
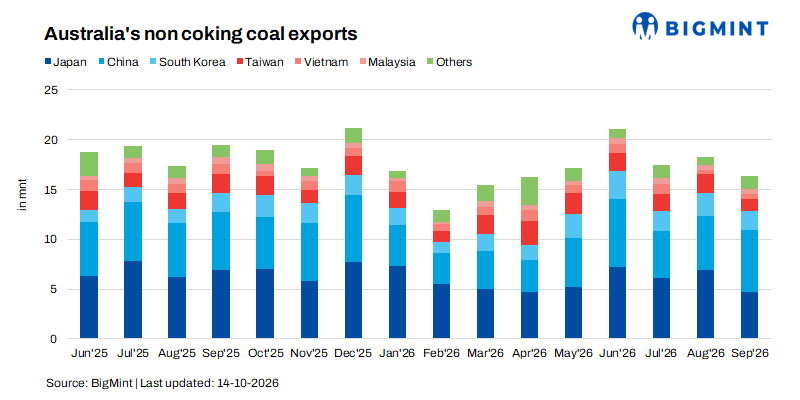
Australia’s non-coking coal exports declined by 16% y-o-y to 16.33 mnt in September 2026. Shipments fell by 10.5% from August and 3.6% from July, as weaker flows to Japan and Taiwan outweighed increased deliveries to China.
The September decline contrasts with modest growth over January-September. Nine-month exports increased by 2% to 151.15 mnt, supported particularly by South Korea, while shipments to China, Vietnam and Malaysia contracted. The underlying picture is therefore mixed: earlier gains have kept annual volumes comparitively higher, but third-quarter exports weakened and destination patterns changed substantially.
September decline centres on Japan and Taiwan
Japan received 4.66 mnt in September, down 32.7% year-on-year and 33.6% from August. Its monthly reduction of 2.36 mnt exceeded Australia’s overall month-on-month export decline of 1.92 mnt. Taiwan also weakened sharply. Shipments fell to 1.15 mnt, down 41.3% year-on-year and 41% from August.
South Korean deliveries declined by 16.6% month-on-month to 1.91 mnt, although they remained broadly unchanged from September 2025.
China moved in the opposite direction. Shipments increased by 8.8% from both August and September 2025 to 6.31 mnt, making it Australia’s largest September destination. China accounted for 38.6% of September exports, compared with 29.8% a year earlier. Japan’s share fell from 35.6% to 28.5%.
The latest month therefore shows a clear shift towards China, even though its nine-month purchases remained below last year.
Nine-month growth rests heavily on South Korea
Japan remained the largest January-September destination at 52.83 mnt, up 2.2% year-on-year. China followed at 43.04 mnt, down 7.7%.
South Korea provided the strongest support to aggregate growth. Shipments increased by 6.97 mnt, or 66.2%, to 17.5 mnt. Its share rose from approximately 7.1% to 11.6%.
That increase exceeded Australia’s entire net export gain of 3.02 mnt, offsetting weaker flows to several other markets.

Taiwan’s nine-month shipments increased by 14% to 16.21 mnt despite its September decline. Indonesia also expanded, receiving 2.40 mnt, up 47.2%.
Conversely, Vietnam fell by 24.7% to 7.57 mnt and Malaysia by 18.6% to 4.32 mnt.
Japan, China, South Korea and Taiwan together absorbed approximately 86% of nine-month exports, underlining Australia’s dependence on these four markets.
India remains small, intermittent destination
Shipments to India declined by 17.6% to 1.82 mnt during January-September, accounting for only 1.2% of Australian non-coking exports.
No shipments were recorded in August or September, following just 0.08 mnt in July. April’s 0.90 mnt accounted for almost half of the nine-month total.
The data show an intermittent trade rather than a steady monthly flow. They do not establish whether pricing, coal specifications, procurement timing or alternative supplies caused the reductions.
Shipper performance diverges
Glencore remained the largest identified shipper, with nine-month volumes increasing by 8.7% to 29.58 mnt. September shipments rose to 3.55 mnt from 3.34 mnt in August, bucking the overall monthly decline.
Other growing shipment labels included Bengalla, up 38.5% to 6.04 mnt; SP Coal Resources, up 36.8% to 3.79 mnt; and Batchfire Resources, up 16.7% to 4.41 mnt. Newhope increased by 14.2% to 2.73 mnt.
Several sizeable entries contracted. Clermont declined by 18.7% to 6.41 mnt, Adani Coal Mines by 6% to 8.36 mnt and Yancoal by 2.5% to 9.28 mnt. Bulga Coal Management fell by 15.7%, while Noble Resources International declined by 21.8%.
September was particularly weak for Bengalla and Clermont, whose shipments fell by 46.5% and 43.8% respectively from August.
However, 44.20 mnt – approximately 29% of nine-month exports – had no identified shipper. The mix of corporate, trading and mine-linked labels also limits conclusions about consolidated producer performance.
Newcastle drives September contraction
Newcastle shipped 11.11 mnt in September, down 19.3% year-on-year and 10.7% from August. Its 2.65 mnt annual reduction accounted for approximately 85% of Australia’s September export decline.
Nevertheless, Newcastle’s nine-month volumes increased by 2.8% to 109.64 mnt, representing almost 73% of national shipments. Gladstone was the strongest major-port performer, increasing nine-month volumes by 16.5% to 14.72 mnt. September shipments also rose, reaching 2.05 mnt.
DBCT and Port Kembla contracted over both comparison periods, while Abbot Point’s nine-month volumes declined modestly. These movements identify weaker export routes, but do not independently establish port congestion or operational constraints.
BigMint assessment
Australia’s nine-month growth masks weaker recent momentum. Third-quarter exports fell by 8.3% year-on-year to 51.52 mnt, following a strong second quarter. South Korea supported annual growth, while China strengthened in September despite remaining below last year over nine months. Japan’s latest decline and Newcastle’s lower loadings explain much of the monthly weakness.
The next test is whether Japan and Taiwan replenish and whether Newcastle volumes recover. Until then, the data point to modest annual growth alongside a softer recent export pace.
Leave a Reply