- China’s buying offsets weaker flows to India and Korea
- DBCT leads nine-month growth; shipper performance remains uneven
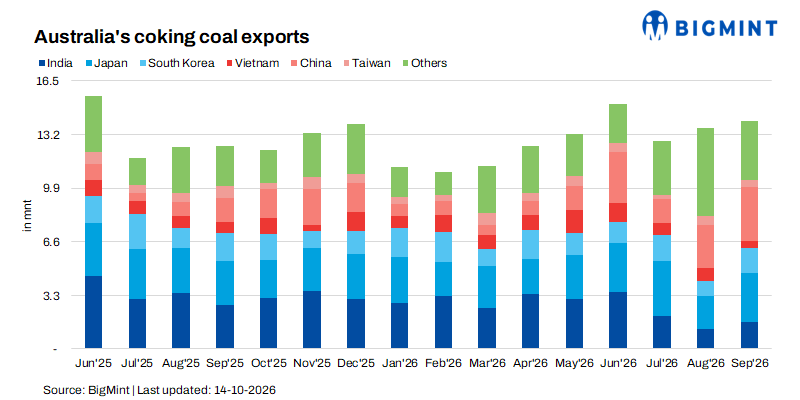
Australia’s coking coal exports increased by 12.4% year-on-year to 14 mnt in September 2026, supported by stronger shipments to China and Japan. Volumes rose by 2.9% from August and 14% from July, although they remained below June’s 15.06 mnt peak.
The recovery was accompanied by a significant change in destinations. China became the largest September market, while shipments to India fell sharply.
During January-September, exports increased by 4.5% to 114.03 mnt. Growth was concentrated in selected markets, shippers and loading terminals, rather than spread evenly across Australia’s export network.
September recovery conceals a sharp change in buyers
Shipments to China reached 3.34 mnt, more than double September 2025’s 1.51 mnt and up 20.1% from August. China accounted for approximately 24% of September exports, compared with 12% a year earlier.
Japan received 3.06 mnt, up 14.6% year-on-year and 36.6% month-on-month.
Together, China and Japan took almost 46% of September shipments, compared with approximately 34% a year earlier.
India moved sharply in the opposite direction. Shipments fell to 1.63 mnt from 3.73 mnt in August and 2.79 mnt in September 2025-a decline of 56.3% month-on-month and 41.6% year-on-year. Its September share consequently halved to approximately 12%.
Vietnam also weakened, receiving 0.43 mnt, down 37.7% year-on-year and 54.7% from August. South Korea recovered from August’s low but remained 12.2% below September 2025.
These movements show a redistribution of Australian supply. They do not, by themselves, establish equivalent changes in steel production or total coal consumption in the receiving countries.
Nine-month growth depends heavily on China
China received 15.37 mnt during January-September, up 89.1% from 8.13 mnt a year earlier. Its additional 7.24 mnt exceeded Australia’s entire net export increase of 4.94 mnt.
China’s growth therefore offset declines elsewhere, particularly India and South Korea.
India remained the largest nine-month destination at 25.98 mnt, but shipments declined by 12.3%. Its share fell from 27.1% to 22.8%, while China’s increased from 7.5% to 13.5%.
Japan strengthened its position, receiving 24.06 mnt, up 7.3%, and narrowing the gap with India.

Vietnam’s nine-month growth contrasts with its weak September performance. Elsewhere, Indonesian shipments declined by 16.5% to 3.40 mnt, while Germany increased by 82.7% to 1.37 mnt.
September also included 1.16 mnt with unidentified destinations, equivalent to 8.3% of exports. These cargoes could alter the final destination picture.
Shipper growth extends beyond the largest supplier
BMA remained the largest reported shipper, exporting 27.22 mnt during January-September. However, volumes were almost unchanged from 27.15 mnt a year earlier, meaning it contributed little to overall growth.
Several other entries expanded substantially:
- Carborough Downs: 2.32 mnt, up 110.9%
- Broadlea: 1.47 mnt, up 177.4%
- Kestrel: 4.23 mnt, up 27%
- German Creek: 3.62 mnt, up 28.8%
- Foxleigh: 2.44 mnt, up 34.1%
- Hail Creek: 6.03 mnt, up 10.4%.
North Goonyella increased from 0.40 mnt to 1.04 mnt, while Moranbah North rose by 36.8% to 1.60 mnt.
Conversely, Anglo American Marketing declined by 25% to 4.86 mnt. Coronado fell by 13% to 4.54 mnt, Poitrel by 12.3% to 2.13 mnt and Whitehaven by 3.2% to 7.81 mnt.
September itself was mixed. Whitehaven rebounded to 0.97 mnt from 0.59 mnt in August, while Hail Creek, Jellinbah and Coronado recorded sizeable monthly reductions.
JERA Global Markets’ reported volumes rose sharply to 1.89 mnt.
DBCT drives growth; Abbot Point recovers late
DBCT added 3.49 mnt during January-September, equivalent to approximately 71% of Australia’s net export increase. It overtook Gladstone as the largest loading terminal in the dataset.
Gladstone and Hay Point also expanded, while Abbot Point and Port Kembla contracted.
Abbot Point nevertheless recorded a strong September recovery to 1.50 mnt, up 31.6% year-on-year and 28.2% from August. Gladstone increased by 14.5% month-on-month, offsetting reductions at DBCT and Hay Point.
These changes identify where shipments grew; they do not establish whether port capacity, mine availability or cargo scheduling caused the differences.
BigMint assessment
Australia’s export recovery strengthened after a weaker first quarter. Third-quarter shipments reached 39.89 mnt, up 8.8% year-on-year.
The central development is the shift in buying patterns: China absorbed substantially more Australian coal, while India’s share declined. Supply growth also came from a wider group of shipment labels, with BMA broadly steady and DBCT leading terminal expansion.
For Indian buyers, higher Australian exports do not necessarily translate into greater availability for India. The next test is whether September’s sharp decline reverses as purchasing and shipment schedules change.
Leave a Reply