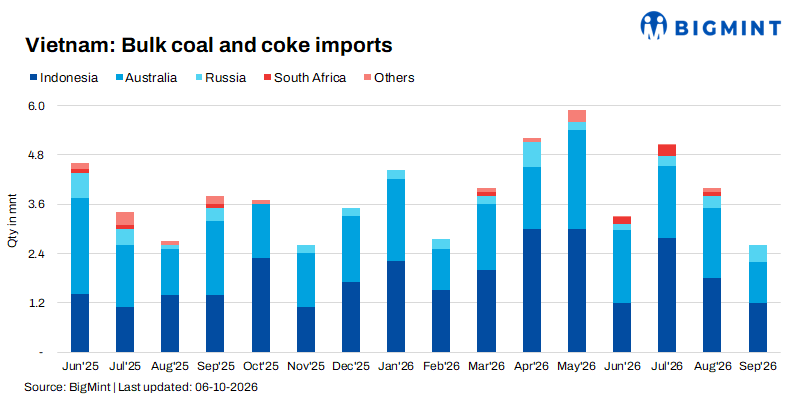
- Non-coking imports fall sharply in Sep; coking coal remains comparatively resilient
- Indonesia gains thermal coal share in Jan-Sep as Australian, Russian supplies decline
Vietnam’s coal and met coke imports declined to approximately 2.6 million tonnes (mnt) in September 2026, down 31.6% from 3.8 mnt a year earlier and 35% from August.
The decline was concentrated in non-coking coal, while coking coal arrivals remained comparatively steady. September’s weakness followed stronger imports earlier in the year, leaving January-September volumes broadly unchanged from 2025.
Beneath that stable nine-month total, procurement changed significantly. Indonesia strengthened its position in non-coking coal, while Australia increased coking coal supplies despite losing ground in thermal shipments.
Import volumes and major sourcing changes

Sep’26 retreat centres on non-coking coal
Non-coking imports fell to 1.6 mnt in September, down 38.5% from 2.6 mnt a year earlier and 40.7% from August’s 2.7 mnt.
September was the weakest month of 2026 for this category. Arrivals had reached 4.3 mnt in May and recovered to 4 mnt in July before declining in August and September.
The sourcing breakdown points to a particularly sharp reduction in Australian cargoes. Australian non-coking arrivals fell to 0.3 mnt, against 1 mnt in September 2025 and 0.7 mnt in August 2026. Indonesian supplies declined more moderately y-o-y, from 1.4 mnt to 1.2 mnt, although they were also below August’s 1.8 mnt.
The monthly pattern indicates a slowdown in seaborne procurement towards quarter-end. However, imports alone cannot establish whether this reflected lower consumption, inventory management, domestic supply availability or shipment timing.
Coking coal imports hold up better
Coking coal imports were approximately 1.1 mnt in September, against 1 mnt a year earlier and 1.2 mnt in August.
Australian supplies stood at 0.8 mnt, unchanged y-o-y, while Russian arrivals increased from 0.2 mnt to 0.3 mnt.
This relative resilience contrasts with the sharp thermal decline. The displayed figures suggest coking coal represented roughly two-fifths of September imports, compared with about one-quarter a year earlier. The shift reflects weaker non-coking arrivals rather than a major September surge in metallurgical coal.
Nine-month stability conceals contrasting trends
January-September coal and met coke imports totalled 37.1 mnt, approximately 0.5% below the 37.3 mnt calculated for the corresponding 2025 period.
Non-coking coal imports declined only 1.5% to 26.9 mnt, despite September’s steep fall. Stronger arrivals in several earlier months, particularly July, cushioned the late-period weakness.
Coking coal imports increased 8.6% to 10.1 mnt, offsetting much of the reduction in non-coking coal and met coke. Their share of combined imports increased from approximately 24.9% to 27.2%.
Met coke imports declined from approximately 0.5 mnt to 0.1 mnt. Japan supplied the reported 2026 cargoes. Higher coking coal imports alongside lower met coke purchases are consistent with greater procurement of upstream steelmaking raw material, but do not independently prove substitution or higher domestic coke production.
Indonesia strengthens its thermal position
Indonesia supplied 18.7 mnt of non-coking coal during January-September, up 2.7 mnt from the corresponding 2025 period.
Its share of Vietnam’s non-coking imports increased from approximately 58.6% to 69.5%. Australia’s share declined from 31.9% to 26.8%, while Russia’s fell from 5.9% to 1.5%.
Indonesia’s growth therefore occurred within a slightly smaller thermal import market, indicating a substantial redistribution of sourcing rather than an expansion in total purchases.
The pattern is consistent with a stronger preference for Indonesian supply. Establishing whether delivered prices, freight, coal quality or plant requirements drove that shift would require corresponding commercial and operational data.
Australia and Russia gain in metallurgical coal
Australia’s coking coal shipments increased by approximately 1.1 mnt to 7.6 mnt, lifting its share from 69.9% to 75.2%.
Russian supplies rose to 2.1 mnt, maintaining a share of approximately 21%. Together, the two origins accounted for roughly 96% of coking imports, compared with 89% a year earlier.
Canadian supplies declined sharply, while US and Mozambican volumes remained small. Vietnam’s metallurgical sourcing consequently became more concentrated.
The distinction between grades is important: Australia and Russia lost thermal volumes but increased coking supplies. Their overall positions cannot be assessed adequately without separating these markets.
BigMint assessment
September’s decline signals weaker near-term thermal procurement, while nine-month figures show broadly stable overall imports and firmer coking coal purchases.
The next test is whether non-coking arrivals recover after their September low or whether reduced purchasing persists into Q4. Inventory levels, power generation and domestic coal availability will help distinguish a temporary shipment slowdown from a sustained change in requirements.
Indonesia enters that period with a stronger thermal market share, while Australia remains Vietnam’s dominant coking supplier. These sourcing shifts are more pronounced than the modest change in aggregate nine-month imports.
Leave a Reply