- Coking coal exports recover in Q3 despite Sep’26 decline
- South Korea anchors growth in non-coking shipments
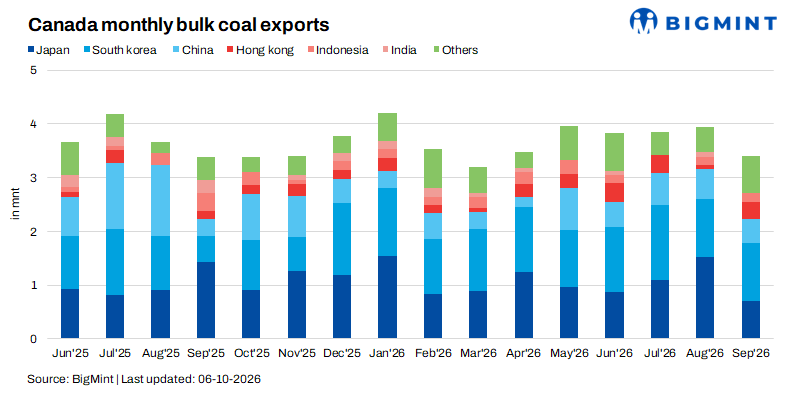
Canada exported 3.40 million tonnes (mnt) of coal in September 2026, broadly unchanged from 3.39 mnt a year earlier, but down 13.9% from August. Higher non-coking shipments offset a y-o-y decline in coking coal exports, keeping the overall monthly volume stable.
January-September exports stood at 33.39 mnt, down approximately 1.5% from 2025. This modest decline masks contrasting performances: coking shipments contracted 6.6%, while non-coking exports increased 26.8%. Destination patterns also changed, with mainland China taking substantially less coking coal and South Korea strengthening its position across both categories.
Coking coal: Sep slows, but q-o-q momentum improves
Coking exports fell to 2.89 mnt in September from August’s 3.63 mnt, the highest monthly volume of 2026. September also trailed July’s 3.08 mnt and was close to June’s 2.91 mnt, indicating that August’s acceleration was not sustained.
Nevertheless, Q3 exports reached 9.60 mnt, up 14.6% from Q2’s 8.38 mnt and 3.0% above Q3CY’25. The quarterly recovery therefore remained intact, although nine-month exports were still 1.90 mnt below the corresponding 2025 level.
Japan accounted for the largest monthly decline. Shipments dropped from 1.53 mnt in August to 0.70 mnt in September. This 0.83 mnt reduction exceeded the overall coking export decline of 0.74 mnt, as increases elsewhere partly cushioned the fall.
September shipments to China declined from 0.63 mnt to 0.44 mnt, while South Korea fell from 0.75 mnt to 0.57 mnt. Against September 2025, however, China increased 41.9% and South Korea 72.7%. Japan declined 44.9%, while no shipment to India was recorded, compared with 0.24 mnt a year earlier.
September’s weakness was consequently concentrated in specific destinations rather than shared uniformly across Canada’s principal markets.
Coking coal trade flows: China contracts as other destinations gain
Mainland China recorded the largest nine-month contraction, with shipments declining 3.64 mnt. Its share of Canadian coking exports fell from 26.4% to 14.7%.
Japan remained the largest destination, absorbing 35.7% of shipments, while South Korea’s share increased to 17.4%. Together, these markets accounted for 53.1% of exports, against 45.9% in 2025.
Higher shipments to Hong Kong, Indonesia, Malaysia, and the Netherlands also cushioned the decline. However, combined China and Hong Kong volumes still fell 31.6% to 5.94 mnt. Hong Kong’s growth did not offset the mainland contraction and recorded destinations do not necessarily establish ultimate consumption.
India’s receipts more than halved to 0.64 mnt, reducing its share from 4.7% to 2.4%. Canada’s coking exports have therefore become more concentrated in Japan and South Korea, while India and mainland China account for smaller shares.
Unidentified destinations represented 0.47 mnt, or 16.3%, of September coking exports, limiting the precision of the latest monthly geographic assessment.
Non-coking coal: Sep rebounds, but Q3 remains weaker
Non-coking coal exports recovered 62.5% m-o-m to 0.52 mnt in September and increased 67.7% y-o-y. However, both August 2026 and September 2025 provided low comparison bases.
September remained below July’s 0.78 mnt, June’s 0.91 mnt and May’s 1.05 mnt peak. Q3 shipments totalled 1.62 mnt, down 43.8% from Q2 and 16.1% below Q3CY’25. The monthly rebound therefore does not yet establish sustained acceleration.
Nine-month exports nevertheless increased to 6.62 mnt, equivalent to 96.6% of full-year 2025 shipments. Non-coking coal’s share of total exports rose from approximately 15.4% to 19.8%, substantially offsetting weaker coking volumes.
Non-coking destinations: South Korea drives growth

South Korea received all 0.52 mnt of September non-coking exports, compared with 0.16 mnt a year earlier. Its increase more than offset the absence of Japan-bound shipments, which had contributed 0.15 mnt in September 2025.
Across nine months, South Korea’s 0.87 mnt increase accounted for approximately 62% of Canada’s non-coking export growth. Its share nevertheless declined from 95.2% to 88.2% as shipments broadened to China, Taiwan, Indonesia, Hong Kong and the UK.
This diversification occurred principally earlier in 2026. Q3 shipments went almost entirely to South Korea, apart from 0.09 mnt to Japan in July, underlining the continuing importance of Korean buying to Canada’s non-coking export performance.
BigMint assessment
Canada’s coal exports show improving quarterly momentum in coking coal alongside weaker recent non-coking shipments. Coking flows have become more concentrated in Japan and South Korea as mainland Chinese and Indian volumes contracted. Non-coking growth remains anchored by South Korea, despite some diversification earlier in the year.
For Q4, the key test is whether coking exports sustain their quarterly recovery and non-coking shipments rebuild towards first-half levels. September’s stable headline volume conceals these distinct trends, making destination-level shipment patterns more informative than the aggregate figure alone.
Leave a Reply