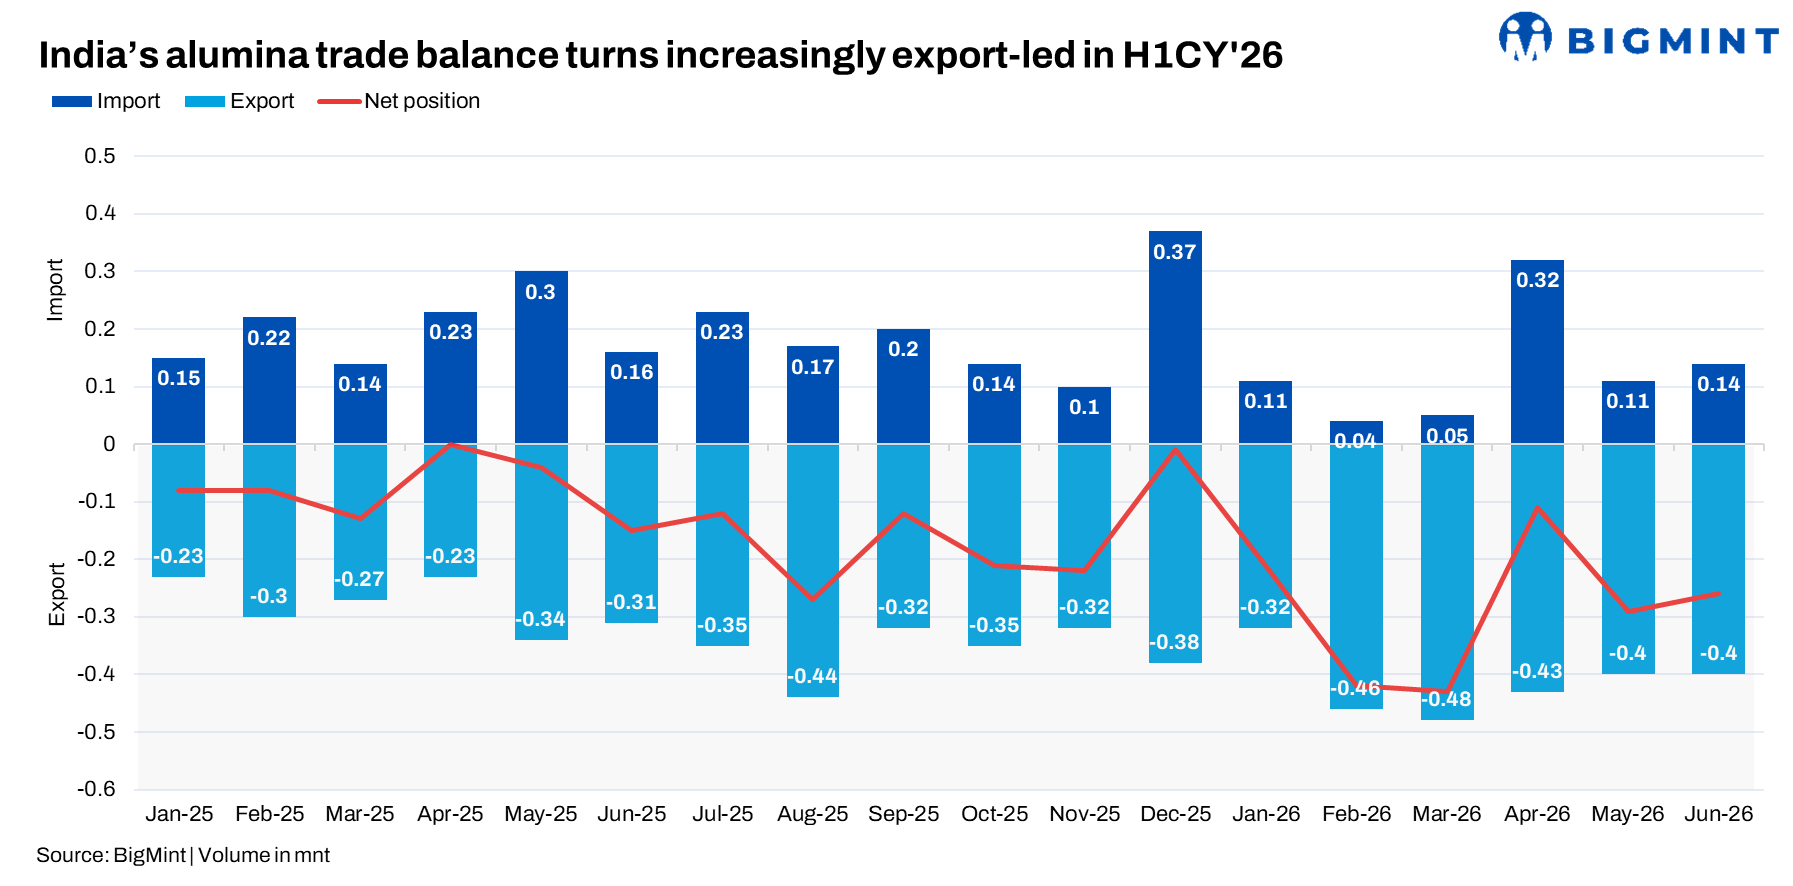
- Trade surplus nearly quadruples during H1
- West Asia disruption reshapes export flows
India’s alumina trade balance strengthened sharply in H1CY’26, with exports rising while imports declined. According to BigMint data, India exported around 2.5 mnt of alumina in H1CY’26, up 49% y-o-y from 1.68 mnt in H1CY’25.
At the same time, imports fell 34% y-o-y to 0.78 mnt from 1.19 mnt.
This pushed India’s net alumina trade surplus to around 1.72 mnt in H1CY’26, compared with 0.49 mnt in H1CY’25.
The sharp increase in exports comes at a time when domestic alumina production has also risen, while changes in global trade flows following disruptions in West Asia have opened up alternative markets for Indian material.
Exports continue to rise
India’s alumina exports have been on an upward trend since Q2CY’24. Quarterly exports increased from 0.46 mnt in Q2CY’24 to 0.88 mnt in Q2CY’25, before reaching around 1.23 mnt in Q2CY’26.
The rise in exports has also changed India’s destination mix.
Oman remained the largest identified destination in H1CY’26, taking around 0.46 mnt, or nearly 18% of total exports.
However, Russia and China saw the biggest increase. Exports to Russia rose to around 0.40 mnt from 0.06 mnt in H1CY’25. Shipments to China increased sharply to 0.19 mnt from just 385 t a year earlier.
Exports to Malaysia also increased, nearly tripling to around 0.09 mnt.
On the other hand, shipments to some traditional destinations declined. Exports to the UAE dropped to around 0.03 mnt from 0.15 mnt, while Egypt fell to around 0.03 mnt from 0.12 mnt.
Higher domestic production adds to export availability
One of the factors supporting higher exports is the increase in domestic alumina production.
Vedanta’s Lanjigarh refinery produced around 2.92 mnt of alumina in FY26, up 48% y-o-y. The company has also expanded the refinery’s capacity, with the unit reaching a 5 MTPA capacity.
NALCO also reported record calcined alumina production of 2.28 mnt in FY26, while alumina sales reached around 1.45 mnt.
The increase in production has improved alumina availability from domestic refineries. For integrated aluminium producers, the bulk of alumina is consumed internally, but higher production can also provide additional volumes for exports depending on smelter requirements and market economics.
This is particularly relevant in H1CY’26, when India’s exports increased even as imports fell sharply.
West Asia disruption changes export flows
The increase in exports also needs to be viewed against the backdrop of the disruption in West Asia.
The region has traditionally been an important market for Indian alumina. NALCO, for instance, has indicated that around 40-50% of its alumina shipments were previously directed towards West Asia. Geopolitical tensions and disruptions to shipping through the region affected these flows and prompted exporters to look for alternative markets.
The change is visible in India’s trade data.
While exports to the UAE and Egypt declined sharply, shipments to Russia, China and Malaysia increased. This suggests that some of the additional export volumes were redirected towards other markets as traditional West Asian routes became more difficult.
China has emerged as one of the important destinations in this shift. China’s alumina imports increased sharply in H1CY’26, with India supplying around 0.15 mnt. India’s exports to China rose from almost negligible levels in H1CY’25 to around 0.19 mnt in H1CY’26.
Therefore, the increase in India’s alumina exports is not only a domestic production story. Higher availability in India coincided with a change in global trade flows, giving Indian producers more opportunities to place material in markets such as China and Russia.
Imports decline despite Q2 recovery
India’s alumina imports fell sharply in H1CY’26, although there was a recovery in Q2.
Imports stood at just 0.19 mnt in Q1CY’26, before increasing to around 0.57 mnt in Q2. Despite the recovery, Q2 imports remained around 17% below the 0.69 mnt recorded in Q2CY’25.
The Q1 decline was therefore a major reason behind the fall in H1 imports.
Imports in Q2CY’26 were, however, slightly higher than the 0.56 mnt recorded in Q2CY’24, suggesting that the weakness was more pronounced in Q1 rather than being a continuous decline in import demand.
Indonesia remains India’s largest supplier
Indonesia continued to dominate India’s alumina import basket, supplying around 0.49 mnt, or 64% of total H1CY’26 imports. This was slightly lower than the 0.53 mnt imported from Indonesia in H1CY’25.
Australia remained the second-largest supplier, although volumes fell to around 0.09 mnt from 0.20 mnt.
Imports from Vietnam declined to around 0.084 mnt from 0.12 mnt, while supplies from China fell to around 0.056 mnt from 0.071 mnt.
Saudi Arabia was an exception, with imports increasing to around 0.027 mnt from 0.004 mnt.
The decline across most of India’s major suppliers, along with the increase in domestic production, reduced the need for imported alumina during the first half.
India enters H2CY’26 with a larger export surplus
The numbers point to a clear change in India’s alumina trade position.
In H1CY’25, India exported around 1.68 mnt and imported 1.19 mnt, leaving a surplus of about 0.49 mnt. In H1CY’26, exports increased to around 2.5 mnt, while imports fell to 0.78 mnt, taking the surplus to 1.72 mnt.
The change has been particularly visible since the beginning of 2026. Exports remained above 0.4 mnt a month in February, March, April, May and June, while imports were only 0.04-0.32 mnt during these months.
The key question going into H2 is whether these higher export volumes can be sustained.
Higher domestic refinery output provides a stronger supply base, but export volumes will also depend on domestic aluminium smelter requirements, global alumina prices, freight costs and the recovery of West Asian markets.
For now, the trade data shows a clear shift: India is moving further towards being a net exporter of alumina, with higher domestic availability and changing global trade flows both supporting the increase in exports.
Leave a Reply