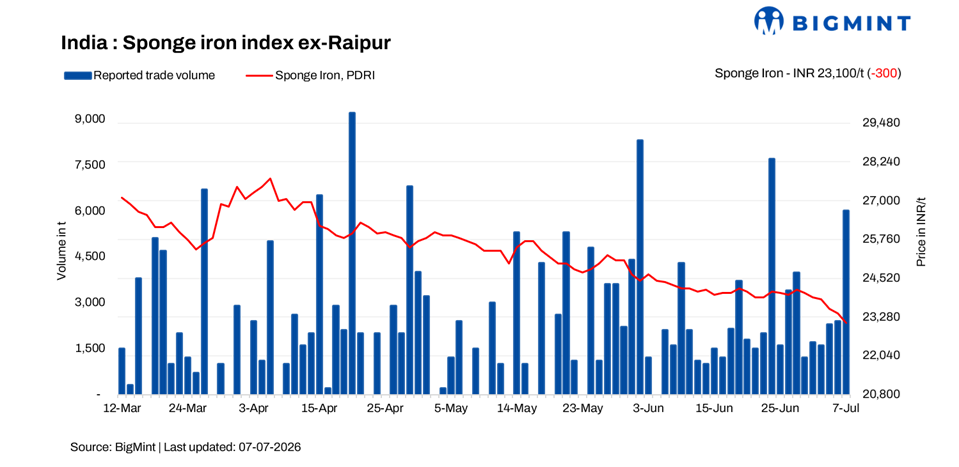
- Raipur sponge prices fall INR 300/t; trade activity improves
- Pellet prices remain at INR 9,100-9,200/t ex-Raipur
Sponge iron prices across India fell by INR 50-300/t d-o-d on 7 July, reflecting continued pressure from sluggish demand and subdued market sentiment. Limited buying interest forced sellers to lower offer prices to secure transactions, with the majority of deals being concluded at the lower end of the prevailing price range.
Regional sentiment
Regional trends remained mixed. In the central region, trading activity improved as lower prices encouraged buying interest. Additionally, a portion of the material from the region was dispatched to the Gujarat market, where sellers secured better realizations compared to the local market. In contrast, the eastern region witnessed slow trading activity, as sellers largely maintained their offer prices, leading to a slowdown in bulk procurement. Meanwhile, sentiment in the southern region also remained weak. Higher local prices prompted buyers to source material from neighbouring markets, where more competitive offers were available, limiting local trading activity.
The finished steel market remained weak, with prices declining by around INR 100-500/t, which continued to weigh on sponge iron demand and kept buyers cautious. However, the downside in sponge iron prices remained limited as raw material costs, particularly pellets and coal, stayed relatively firm and did not support any major price correction.
Trade movement
According to BigMint, approximately 16,000 t of sponge iron trades were recorded on 7 July, up by around 2,000 t from the previous trading day. The rise in trading volumes reflected a modest improvement in buying sentiment, largely driven by increased procurement activity in the central region following the recent price correction.
Rationale
Prices have been derived based on transactions, offers, bids, and indicative price data sets. Transactions are considered as T1 and given a weightage of 50%, whereas other data sets are considered as T2 and given a weightage of the balance 50%.
Click here for detailed methodology


Leave a Reply