- Demand up, supply down – prices hit INR 10,000/MWh cap
- Solar dip led to sharp evening price spike.
The Indian short-term power market witnessed notable volatility over the last eight days, culminating in a sharp price spike on the Day-Ahead Market (DAM) on March 26, 2026. After a period of relative stability driven by high renewable generation, the market saw a reversal as supply tightened during peak evening hours, pushing prices to the market ceiling.
Week-in-Review: A Tale of two markets
Analysis of IEX Day-Ahead Market data from March 19 to March 26 reveals a market heavily influenced by weather patterns, renewable generation, and shifting demand curves. Daily average prices over this period ranged from a low of INR 2,741/MWh on March 22 to a high of INR 4,136/MWh on March 19, with the eight-day average settling at INR 3,350/MWh.
A closer look at daily average trends shows demand climbing steadily while supply contracted towards the end of the period. Total daily purchase bids increased from 341,026 MWh on March 19 to 400,344 MWh on March 26, a rise of over 17%, aligning with seasonal demand patterns as temperatures rise. Conversely, sell bids peaked at 720,457 MWh on March 22 but declined consistently thereafter, dropping to 537,263 MWh by March 26-a reduction of over 25% in offered supply over four days. The average MCP fell to a low of INR 2,741/MWh on March 22, coinciding with peak sell bid availability, and then climbed steadily to INR 4,023/MWh by March 26 as supply tightened.

The Mid-March lull (March 19-22)
The period began with moderate prices. On March 19, the Market Clearing Price (MCP) ranged from a low of INR 1,795/MWh during the daytime to a high of INR 3,990/MWh in the morning. Daily average purchase bids stood at 341,026 MWh, while sell bids were comfortably higher at 412,759 MWh, indicating a balanced supply-demand scenario at the aggregate level.
A notable feature during this period was the high sell bids during solar hours, which kept prices subdued. However, the evening peak hours (19:00-20:00) on March 19 saw a sharp jump to INR 6,553/MWh, hinting at the evening supply crunch that would escalate later in the week. By March 22, sell bids peaked at 720,457 MWh, contributing to the period’s lowest average MCP of INR 2,741/MWh.
Transition and tightening (March 23-25)
By March 23, market dynamics began to shift. While daytime prices remained low-hitting a minimum of INR 986.76/MWh at 13:00 hours-the evening peaks became steeper, widening the gap between day and night prices significantly. Daily average purchase bids rose to 390,560 MWh by March 25, while sell bids contracted to 586,065 MWh, reflecting growing demand-side pressure. The actual transacted volume (MCV) peaked on March 25 at 228,611 MWh, indicating healthy market participation even as supply began to tighten.
March 24 and 25 exhibited a classic “duck curve” pattern, with solar generation flooding the market during the day and pushing prices down to near INR 1,000/MWh between 13:00 and 14:00. As the sun set, thermal and hydro generators faced challenges in ramping up quickly enough to meet the surge in evening demand, pushing the evening peak price on March 25 to INR 7,474.99/MWh at 20:00 hrs.
Tightening supply (March 26)
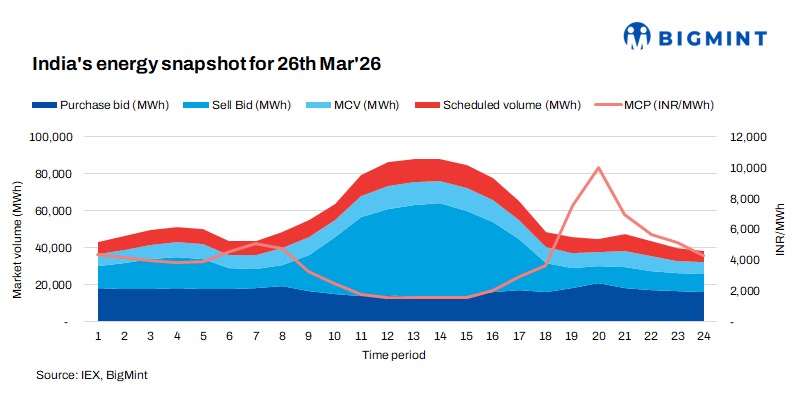
Today’s market data shows further strain. While morning hours saw relatively stable prices around INR 4,000/MWh, the evening block (19:00-20:00) witnessed a significant imbalance, with the MCP hitting the upper circuit limit of INR 10,000/MWh. Despite the high price, the final scheduled volume was only 7,508.52 MWh against purchase bids of 20,651.40 MWh, as sell bids dropped to 9,300.13 MWh during this hour.
At the daily average level, March 26 recorded the highest purchase bids of the eight-day period at 400,344 MWh, while sell bids contracted to their lowest since March 19 at 537,263 MWh. The transacted volume eased slightly to 217,470 MWh despite higher demand, suggesting that a portion of demand remained unserved, particularly during peak hours.
Graphical Analysis: Yesterday vs. Today
The graph for March 25 illustrates a high-volatility day with a distinct “V-shaped” recovery in the evening. Morning prices saw a minor spike to around INR 4,500/MWh, followed by a sharp midday collapse to nearly INR 1,500/MWh as solar generation flooded the grid. The evening rally saw prices climb steadily, crossing INR 7,500/MWh by 20:00 hrs.

The graph for March 26 shows an intensification of this trend, with an extended low-price window through the afternoon followed by a steep upward movement starting at 17:00 hrs. By 20:00 hrs, the price touched INR 10,000/MWh, indicating a scarcity scenario where available generation was fully dispatched and some demand remained unfulfilled.
Key Observations and Market Drivers
Data from March 23 to 26 consistently shows that between 13:00 and 15:00, market prices dropped to between INR 986/MWh and INR 1,500/MWh, reflecting strong renewable generation during solar hours while putting pressure on conventional plants to manage rapid ramping requirements. The period saw notable volatility during the evening peak, with March 26 witnessing a INR 6,500/MWh swing within three hours-from approximately INR 3,500 at 17:00 to INR 10,000 at 20:00.
The contraction in sell bids on March 26, even as purchase bids remained high, points to tighter generation availability during the evening window, with the broader trend of rising daily purchase bids alongside falling sell bids from March 22 onward underscoring the growing demand-supply imbalance.
Conclusion
The Indian electricity exchange experienced a week of shifting dynamics, with daily average prices reflecting growing demand and tighter supply by the end of the period. The graphs for March 25 and 26 show the “duck curve” in action-cheap solar power during the day followed by higher-priced generation in the evening. As summer approaches and cooling loads increase, market participants and system operators will likely need to monitor evening ramp-up requirements closely to manage price volatility.

Leave a Reply