- China and DRC drive 57% of global refined copper output
- Global secondary copper production up 5.4%, mainly from China
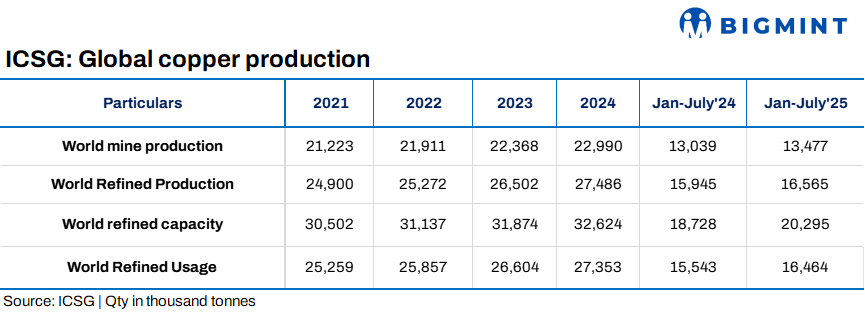
The International Copper Study Group (ICSG) has released preliminary data for January-July 2025, showing that global refined copper production increased by around 3.9% y-o-y. This included a 3.6% rise in primary production (from ores via electrolytic and electrowinning processes) and a 5.4% increase in secondary production (from scrap).
Regional trends in refined copper production
The growth in global refined copper production was primarily driven by China and the Democratic Republic of Congo (DRC), which together accounted for about 57% of total output and recorded a combined increase of 8.2%. Excluding these two countries, world refined copper output rose by approximately 0.5%.
In Asia (excluding China), production declined by around 3.4%, largely due to lower output in Japan and the Philippines. Japan’s refined copper output fell 8.3% following smelter maintenance shutdowns, while the Philippines saw a 57% drop due to the closure of the Pasar refinery. In Indonesia, the Amman refinery began cathode production in late March, and the Manyar smelter/refinery commenced production in July. India’s refined copper output increased by 25%, driven by improved operating capacity rates.
Chilean refined copper production declined by 8.6%, with electrolytic output down 9.6% due to smelter maintenance, and solvent extraction-electrowinning (SX-EW) production falling 8%.
Meanwhile, global secondary refined copper production (from scrap) rose by 5.4%, primarily supported by higher output in China.
Copper mine output up
Global copper mine production increased by approximately 3.4% y-o-y during the first seven months of 2025, with concentrate output rising 3.3% and solvent extraction-electrowinning (SX-EW) up 3.7%. The growth was supported by new projects ramping up to capacity and improved performance at several operating mines.
Chile’s copper mine production rose 2.3%, driven by higher output at Escondida, Centinela, Mantos Copper, and Codelco, which more than offset declines at Collahuasi, Los Pelambres, and other smaller mines.
Peru’s mine output increased 3.3%, led by gains at Las Bambas and Toromocho that offset lower production at Cerro Verde, Antamina, and Antapaccay.
In the Democratic Republic of Congo (DRC), copper production grew about 11.8%, mainly due to expansions at the Kamoa (concentrates) and Tenke/Kisanfu (SX-EW) operations.
Mongolia’s copper concentrate production surged 34% following the ramp-up of the Oyu Tolgoi underground project.
Meanwhile, Indonesia’s mine output fell 32%, primarily due to planned major maintenance at Grasberg and lower production at Batu Hijau resulting from mine sequencing.
Refined copper usage grows
Global apparent refined copper usage rose by an estimated 8.9% in China, excluding changes in bonded and unreported stocks. Net refined copper imports fell by 3%, as imports dipped 0.1% while exports rose 15%. China continues to account for about 58% of total world refined copper usage.
World refined copper usage excluding China increased by around 2%, supported by growth in several Asian and MENA countries, which offset weaker demand in the EU, Japan, and the US.
Market surplus rises
The global refined copper market posted a preliminary surplus of about 101,000 t in the first seven months of 2025, compared with a surplus of 401,000 t in the same period of 2024. After adjusting for estimated changes in Chinese bonded stocks, the market surplus is assessed at around 163,000 t. Combined copper stocks at the major exchanges (LME, COMEX, SHFE) stood at 493,610 t at the end of July, up 14.7% from December 2024.
Copper prices
The average LME cash price for August was $9,646/t, down 1.4% from July. The highest price so far in 2025 was $10,120/t on 3 July, while the lowest was $8,539/t on 9 April. The year-to-date average stands at $9,538/t, which is 4.3% higher than the 2024 annual average.
China’s bonded stocks are estimated to have increased by around 62,000 t in January-July 2025 compared to end-2024 levels. Combined copper stocks at LME, COMEX, and SHFE stood at 493,610 t at the end of July, up 14.7% (or 63,383 t) from December. Stocks declined at the LME by 112,475 t but rose at COMEX by 170,281 t and at SHFE by 5,576 t.
Leave a Reply