- China’s refined copper output rises 6% in H1CY’25
- Indonesian copper mine production falls by 36%
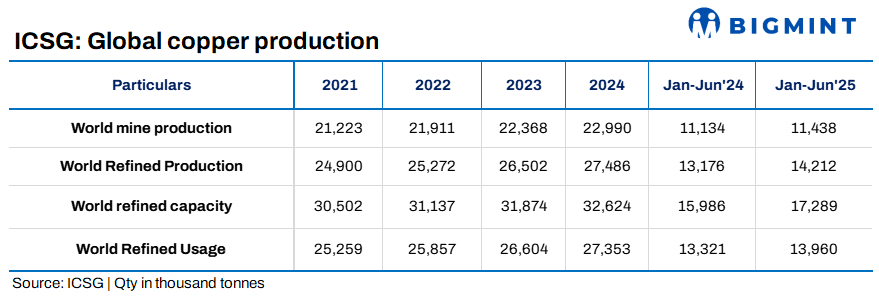
The International Copper Study Group (ICSG) has released preliminary data for January-June 2025, indicating that global refined copper production rose by approximately 3.6% y-o-y. This included a 3.6% increase in primary production (from ores via electrolytic and electrowinning processes) and a 3.7% rise in secondary production (from scrap).
Regional trends in refined copper production
The growth in refined copper production was largely driven by China and the Democratic Republic of Congo (DRC), which together account for about 56% of global refined output and posted a combined increase of 6.2% (China up by 6% and DRC up by 6.5%). Refined production in the rest of the world increased only by about 0.6%.
In Asia (excluding China), output rose by 2.3%, supported by higher production in India. Indonesia saw progress with the Amman refinery commencing cathode production in late March and the Manyar smelter/refinery beginning operations in July. Meanwhile, Japan’s refined copper output declined by 8.8% due to a smelter maintenance shutdown.
Chile recorded an overall 8.4% drop in refined copper production, with electrolytic volumes down 10.4% on account of smelter maintenance and solvent extraction-electrowinning (SX-EW) output lower by 7.3%.
Meanwhile, Global secondary refined copper production increased by 3.7%, primarily supported by growth in China.
Copper mine output up
The global copper mine production increased by 2.7% y-o-y in the first half of 2025, with concentrate output rising 2.8% and solvent extraction-electrowinning (SX-EW) up 2.3%. The growth was supported by ramp-ups at new projects and improved performance at several operating mines.
Peru’s mine production rose by 3.6%, driven by higher output from Las Bambas and Toromocho, which offset declines at Cerro Verde, Antamina, and Antapaccay. The Democratic Republic of Congo (DRC) posted a 9.5% increase, supported by the expansion of the Kamoa mine (concentrates) and stronger production at the TFM and KFM SX-EW operations. Mongolia’s output surged 31% with the ramp-up of the Oyu Tolgoi underground project.
Chile’s production grew 2.6%, as increased volumes from Escondida, Centinela, Mantos Copper, and Codelco outweighed losses at Collahuasi, Los Pelambres, and other mines.
In contrast, Indonesia’s mine output dropped sharply by 36% due to planned major maintenance at Grasberg and lower output at Batu Hijau linked to mine sequencing.
Refined copper usage grows
Global apparent refined copper usage rose by 4.8% y-o-y in the first half of 2025.
China’s apparent demand (excluding changes in bonded and unreported stocks) increased by about 7.5%. However, net refined copper imports fell by 2.6%, as imports declined 1.9% while exports rose 2%.
China currently accounts for around 58% of total world refined copper usage.
Global consumption excluding China grew by about 1%, with gains in several Asian and MENA countries offset by weaker demand in the EU, Japan, and the United States.
Market surplus rises
The global refined copper market recorded a surplus of 251,000 t in January-June 2025, rising to 300,000 t after adjusting for Chinese bonded stock changes, based on estimates from market consultants. Combined copper stocks at LME, COMEX, and SHFE stood at 450,752 t at the end of July, up 4.8% from December.
Copper prices
The average LME cash price for July was $9,778/t, down 0.6% from June. The highest price so far in 2025 was $10,120/t on 3 July, while the lowest was $8,539/t on 9 April. The year-to-date average stands at $9,497/t, which is 3.8% higher than the 2024 annual average.
Combined copper stocks at LME, COMEX, and SHFE stood at 450,752 t at the end of July, up 4.8% (or 20,524 t) from December. Stocks declined at the LME by 129,600 t and at SHFE by 749 t but rose at COMEX by 150,873 t.
Leave a Reply