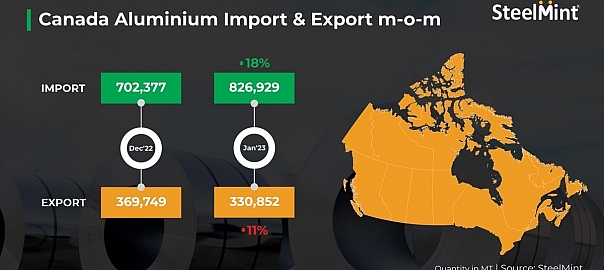
Canada’s aluminium imports stood at 826,929 tonnes (t) in January 2023, customs data show. Volumes rose by 18% m-o-m compared to 702,377 t in December 2022. Imports increased by 33% from 623,329 t in January 2022.
Brazil’s exports of ores/concentrates to Canada edged up compared to the previous month, which had a noticeable impact on overall imports by Canada.
Sub-commodity-wise imports
- Ores/concentrates: Imports stood at 748,272 t in January 2023, up 17% m-o-m compared to 640,611 t in December 2022.
- Semi finished products: Imports rose by 34% m-o-m to 14,066 t in January 2023 from 10,483 t in the previous month.
- Scrap: Imports saw a rise of 3% m-o-m to 11,008 t compared to 10,655 t in December 2022.
- Finished products: Import volumes went up by 32% m-o-m to 53,582 t in January 2023 compared to 40,628 t in December.
Country-wise imports-
- Imports from Brazil: Canada’s aluminium imports from Brazil were recorded at 531,845 t in January, an increase of 27% m-o-m from 420,046 t in December. Similarly, volumes increased sharply by 20% y-o-y from 443,484 t in January 2022.
- Imports from Australia: Canada imported 95,139 t of aluminium from Australia in January 2023, stood largely stable with a slight rise of 0.41% m-o-m in December at 94,750 t.
Canada’s aluminium exports down 11% m-o-m
The country’s aluminium exports stood at 330,852 t in January, a fall of 11% m-o-m as against 369,749 t in December. Exports were up 9% y-o-y from 304,261 t in January.
Canada, the largest exporter of aluminium to the US, shipped lower volumes in January compared to December amid increased demand for aluminium in the domestic market. There was a significant decrease in export volumes of aluminium to the Netherlands compared to December.
Sub-commodity-wise exports-
- Ores/concentrates: Exports stood at 5,848 t in January, up 66% m-o-m compared to 3,526 t in December.
- Semi-finished products: Exports fell by 15% m-o-m to 241,363 t in January from 284,289 t in the previous month.
- Scrap: Imports declined 9% m-o-m to 45,485 t in January compared to 49,946 t in December.
- Finished products: Export volumes rose by 19% m-o-m to 38,155 t in January compared to 31,987 t in December.
Country-wise exports-
- Exports to US: Canada exported 302,743 t to the US in the month under review, down by 5% m-o-m compared to 320,241 t in December. However, shipments rose by 10% compared to 276,201 t in the corresponding period last year.
- Exports to the Netherlands: Exports to the Netherlands stood at 4,731 t in January, down 77% compared to 20,785 t in December. Export volumes.

Leave a Reply